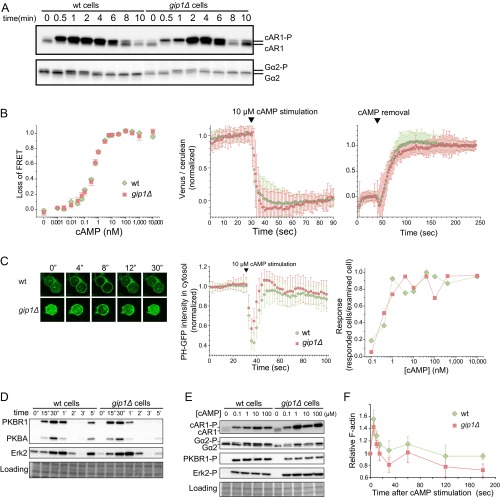
Fig. S3.
gip1Δ cells exhibit normal cAMP-related responses. (A) cAR1 and Gα2 phosphorylation in WT and gip1Δ cells upon cAMP stimulation was evaluated by mobility shifts. Proteins were detected by immunoblots with each specific antibody. (B) G-protein activation was monitored by FRET changes between Gα2-Cerulean and Venus-Gβ. The dose–response for cAMP was measured with a fluorometer. Cells were mixed with cAMP at the indicated final concentrations for 1 min, and the loss of FRET, which represents the dissociation or activation of G proteins, was measured. Data represent the mean ± SEM of four experiments (Left). Upon the addition of 10 μM cAMP, FRET was measured at 1-s intervals in cells placed on coverslips. Values represent the mean ± SD of the normalized fluorescence ratio of Venus to Cerulean (n ≥ 40 cells). cAMP triggered a decrease in FRET (Middle). Cells were pretreated with 10 μM cAMP, and upon cAMP removal, FRET recovery was measured. Each value represents the mean ± SD of the normalized fluorescence ratio of Venus to Cerulean (n ≥ 50 cells) (Right). (C) Cells expressing the AKT PH domain fused to GFP (PHAKT-GFP; a live reporter of PIP3) were stimulated with 10 μM cAMP in the presence of 5 μM latrunculin A. Images were acquired at 2-s intervals. (Left) Representative images of PHAKT-GFP translocated from the cytosol to the plasma membrane within 8 s in WT and gip1Δ cells, indicating normal activation of the PIP3 pathway. Cytosolic intensity of PHAKT-GFP was monitored before and after application of 10 μM cAMP. The reduction in fluorescence intensity in the cytosol corresponded to PIP3 production at the plasma membrane (Middle). The dose–response of cells expressing PHAKT-GFP is plotted. Curves were similar for WT and gip1Δ cells, indicating that both cell types were equally sensitive to cAMP (Right). (D) Phosphorylation levels of PKBR1 and PKBA or Erk2 were assessed by immunoblotting with anti-phospho-PKC (pan) and anti-phospho Erk1/2 antibodies, respectively. The blot was stained with Amido Black to visualize the loading control. (E) WT and gip1Δ cells were stimulated by the indicated cAMP concentrations, and the phosphorylated forms of cAR1, Gα2, PKBR1, and Erk2 were assessed. Both cell types responded similarly at each cAMP concentration. (F) Quantitative analysis of F-actin formation triggered by 1 μM cAMP stimulation.

