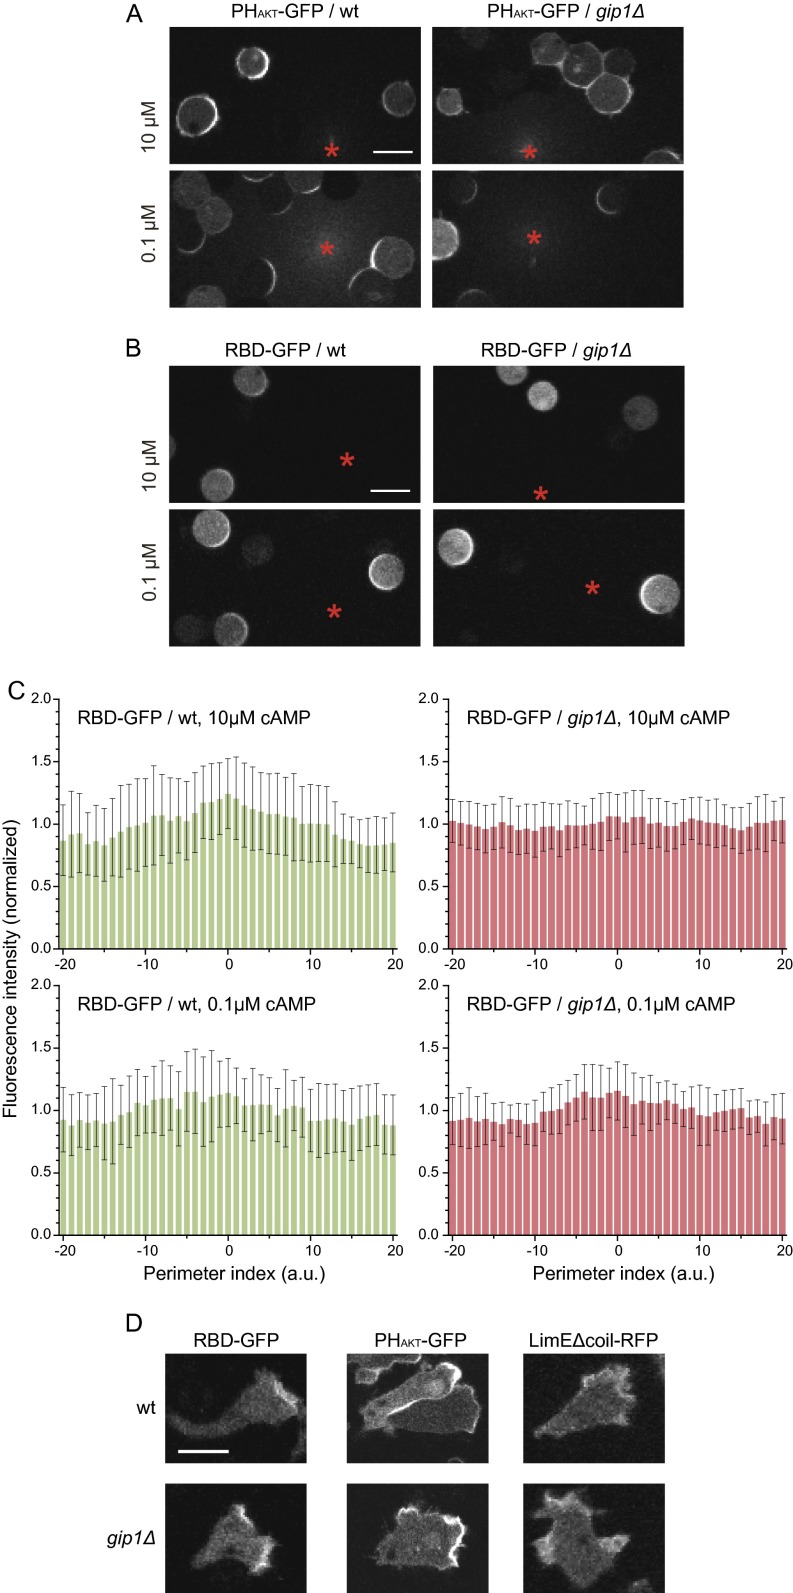
Fig. S6.
Gip1 processes chemoattractant gradient information. (A) Shown are 5 µM latrunculin A-treated cells expressing PHAKT-GFP that were exposed to a gradient of 10 (Upper) or 0.1 (Lower) μM cAMP in a micropipette tip (*). The images after 3 min of gradient stimulation are shown. (Scale bar, 10 µm.) (B) The same experiment was performed using the RBD of Raf (RBD)-GFP to detect the active form of Ras proteins. (Scale bar, 10 µm.) (C) The cell perimeter was divided into 40 points as in Fig. 5, and the relative intensities (mean ± SD) of RBD-GFP in WT and gip1Δ cells are shown as histograms in green and red, respectively. (D) Molecular distributions of activated Ras, PIP3, and F-actin were observed by RBD-GFP, PHAKT-GFP, and LimEΔcoil-RFP, respectively, at 3 min after application of the cAMP gradient, which was applied using a micropipette. gip1Δ cells exhibited less polarity and more variations in the direction of activated Ras, PIP3, and F-actin accumulation. (Scale bar, 10 µm.)

