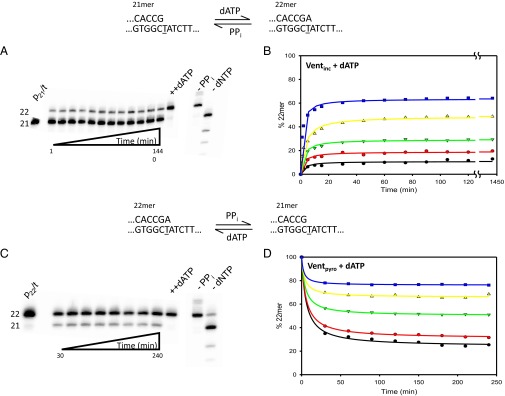
Fig. 2.
Forward and reverse reactions for correct incorporation of dATP opposite T by Vent pol. (A) Gel data showing the forward reaction for correct (A•T) incorporation. The sketch at the top shows the starting primer (21mer) being extended by the correct incorporation of dATP. The gel bands show results obtained at 8 μM concentration of dATP. The amount of DNA22 (A•T) increases with time until an apparent steady state is reached, within 20 min, and stays nearly constant for 24 h. Upon addition of 1 mM dATP after the 24-h incubation, the primer becomes fully extended, showing the enzyme is active throughout the reaction. (A, Right) The two controls show the reaction without PPi and dNTP. (B) Amount of DNA22 (A•T) observed as a function of time at various dATP concentrations: 0.5 μM (black circles), 1 μM (red circles), 2 μM (green triangles), 4 μM (yellow triangles), and 8 μM (blue squares). In each case dGTP is present at 50 μM in the reaction to prevent pyrophosphorolysis continuing beyond the 20mer. (C) The sketch at the top describes the pyrophosphorolysis reaction converting 22mer primer to 21mer. The gel bands show results of reaction with 8 μM dATP and 15 mM PPi starting with 22mer as initial primer. As the reaction is carried out, aliquots are quenched at various times to show the increase in amount of 21mer produced [DNA21 (G•C)]. At the end of the 4-h reaction, a large amount of dATP is added (++dATP) to show the enzyme is still active. The final two lanes show the reaction products when only dNTPs are included (−PPi) and when only PPi is included (−dNTP). (D) Reverse reactions starting from a correctly matched p/t [DNA22 (A•T)] are shown at various dATP concentrations: 0.5 μM (black circles), 1 μM (red circles), 2 μM (green triangles), 4 μM (yellow triangles), and 8 μM (blue squares). dGTP is also present at 50 μM in each case to prevent pyrophosphorolysis continuing beyond the 20mer.

