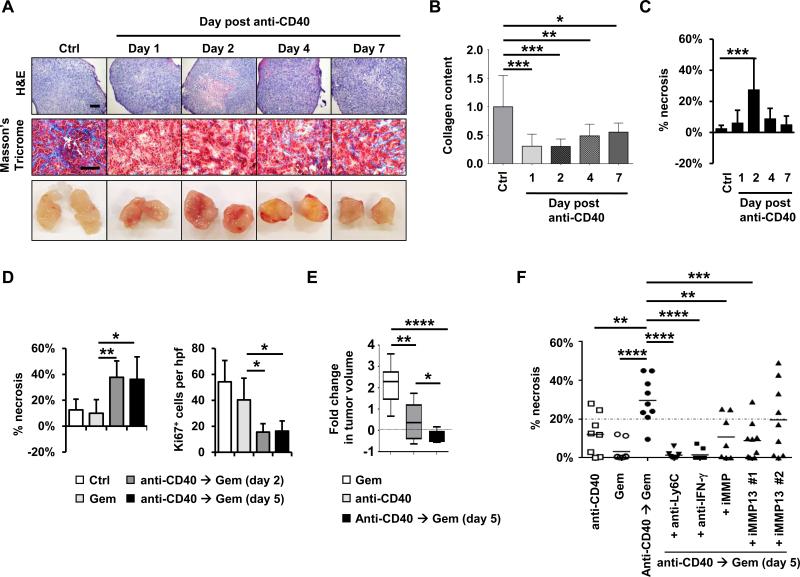
Figure 6. CD40 agonist improves gemcitabine efficacy in PDAC.
(A) Representative H&E, Masson's Trichrome, and gross images of implanted PDAC tumors obtained from mice at defined time points after treatment with anti-CD40 antibodies with comparison to isotype control (Ctrl). Scale bars, 500 μm (H&E) and 100 μm (Masson's Trichrome). (B) Quantification of collagen content in PDAC tumors detected by Masson's trichrome relative to control treatment. n=7-8 tumors per group. (C) Quantification of tumor necrosis seen on H&E imaging. n=7-8 tumors per group. (D) Mice with implanted PDAC tumors were treated with anti-CD40 on day 0 followed by gemcitabine on day 2 or 5 as indicated with comparison to gemcitabine alone. Shown is quantification of tumor necrosis and cellular proliferation (Ki67) detected by H&E and immunohistochemical staining, respectively, at one day after gemcitabine treatment. n=5 mice per group. (E) Mice with implanted PDAC tumors were treated with or without anti-CD40 antibody on day 0 followed by gemcitabine on day 5. Shown is fold change in tumor volume from time of gemcitabine treatment to 6 days later. n = 8-9 mice per group. (F) Effect of anti-Ly6C, anti-IFN-γ, broad spectrum MMP inhibitor (iMMP, Actinonin) and MMP13 specific inhibitors (iMMP13 #1, WAY-170523; iMMP13 #2, 544678-85-5) on tumor necrosis induced with gemcitabine administered 5 days after anti-CD40 therapy with comparison to anti-CD40 and gemcitabine alone. Tumor necrosis is quantified one day after treatment with gemcitabine. For panels B-F, significance testing was performed using one-way Anova with Bonferroni correction for multiple pairwise comparisons or unpaired 2-tailed Student's t test. *, P<0.05; **, P<0.01; ***, P<0.001; ****, P<0.0001.

