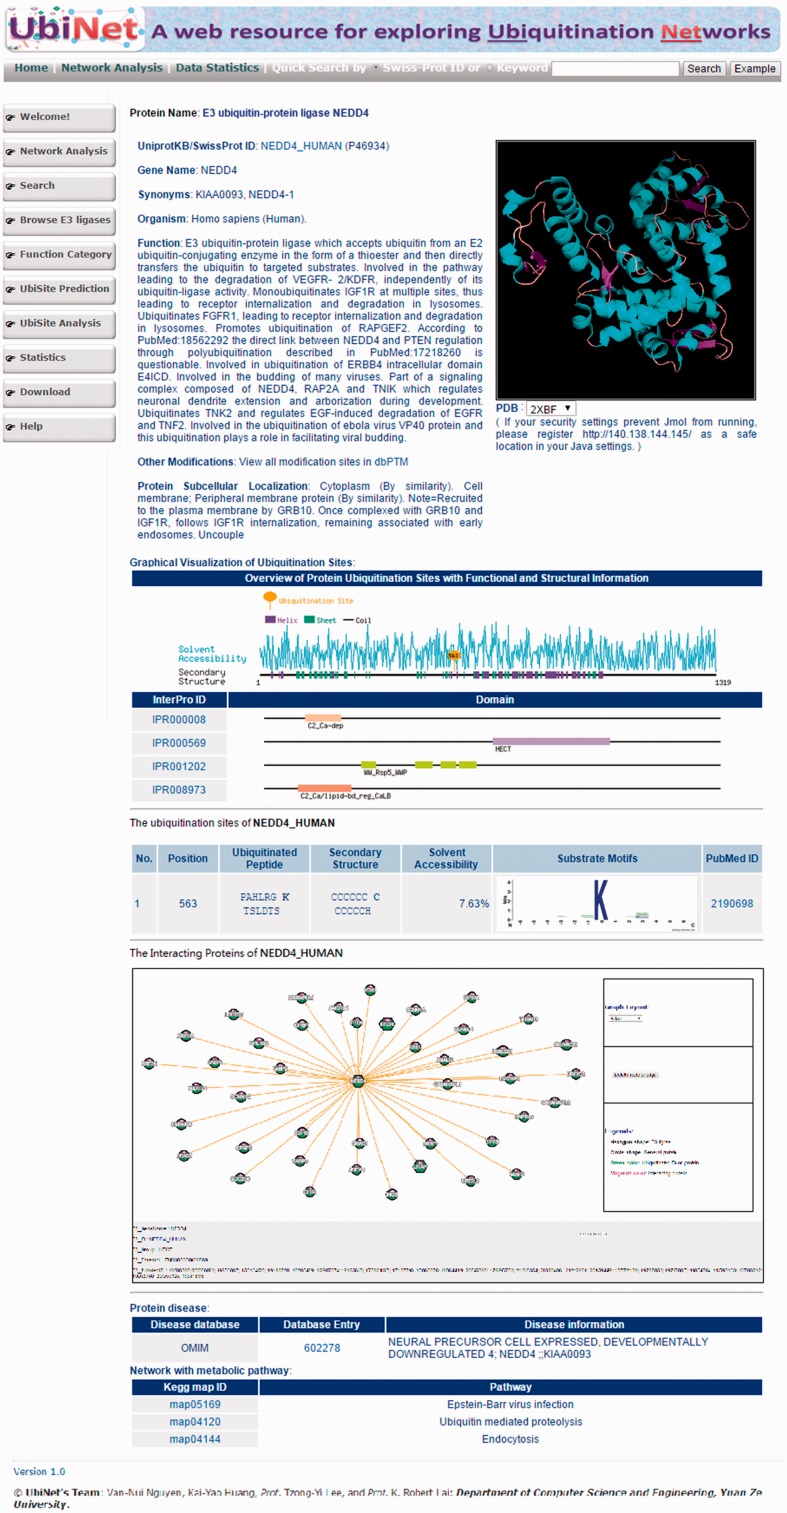
Figure 3.
Web interface of a typical UbiNet query, including basic protein information, graphical visualizations of ubiquitylation sites with structural characteristics and functional domains, a table of ubiquitylated sites with substrate motifs and supported literature, a dynamic visualization of E3-substrate networks, disease associations and KEGG metabolic pathways associated with the network.

