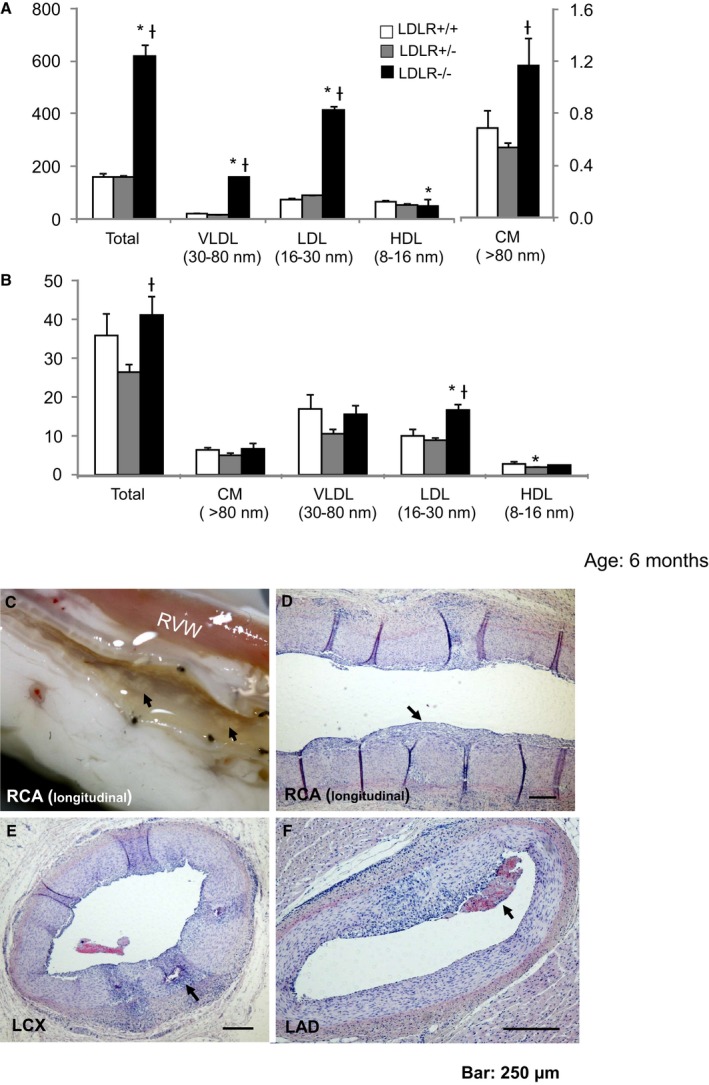
Figure 3.

Serum lipoprotein concentrations and coronary atherosclerosis in LDLR −/− pigs fed a standard chow diet. A, Cholesterol concentrations (mg/dL) of VLDL, LDL, HDL, and CM. B, Triglyceride concentrations (mg/dL) of VLDL, LDL, HDL, and CM. C, Longitudinal macroscopic view of the RCA; arrows show atherosclerotic lesions (fatty streak). D, Longitudinal H&E‐stained section of RCA; arrow shows intimal thickening. E, H&E‐stained cross section of LCX; arrow shows calcification. F, H&E stained cross section of LAD; arrow indicates mural thrombosis. *P<0.05 vs LDLR +/+; † P<0.05 vs LDLR +/−. CM indicates chylomicron; H&E, hematoxylin and eosin; HDL, high‐density lipoprotein; LAD, left anterior descending coronary artery; LCX, left circumflex coronary artery; LDL, low‐density lipoprotein; RCA, right coronary artery; RVW, right ventricular wall; VLDL, very low‐density lipoprotein.
