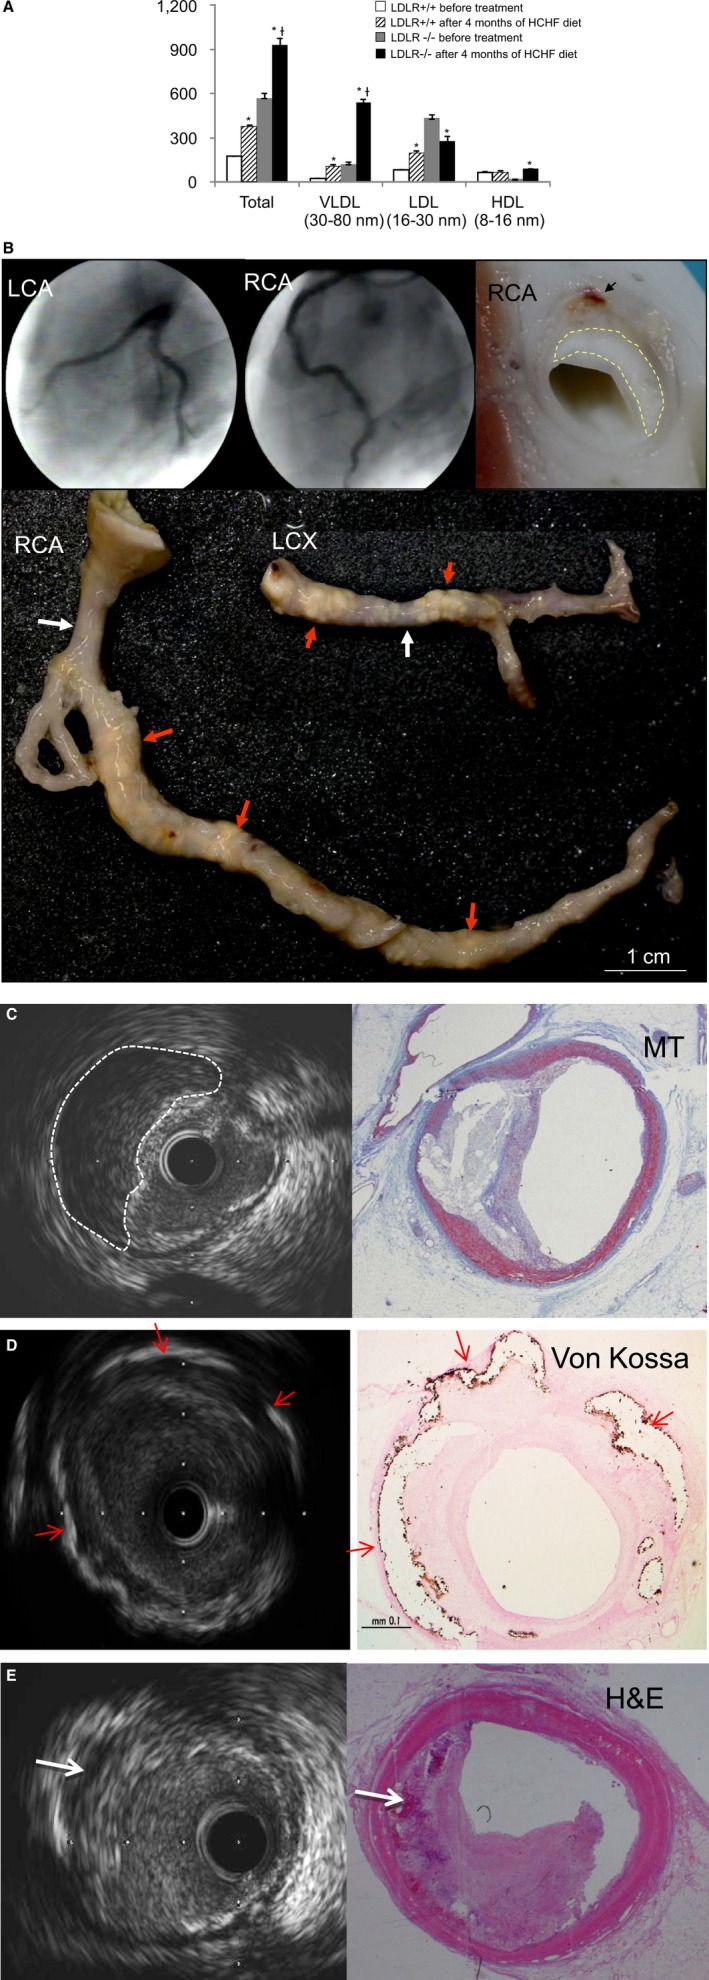
Figure 4.

Cholesterol concentrations (mg/dL) and human‐like advanced coronary plaque in LDLR −/− pigs fed an HCHF diet for 4 months. A, Cholesterol concentrations (mg/dL) before and 4 months after HCHF diet. HDL indicates high‐density lipoprotein; LDL, low‐density lipoprotein; VLDL, very low‐density lipoprotein. *P<0.01, after vs before treatment; † P<0.01, LDLR −/− after treatment vs LDLR +/+ after treatment. B, Coronary angiography (upper left and middle images); macroscopic view of an RCA cross section (upper right); and dissected LCX and RCA (lower); yellow dashed line traces necrotic area, black arrow indicates intraplaque hemorrhage, red arrows indicate massive and rough atherosclerotic lesions with positive vessel remodeling; white arrows indicate relative noninvasive regions. C, IVUS image and MT‐stained section at same location; white dashed line traces necrotic core. D, IVUS image and Von Kossa–stained section at same location; red arrows indicate calcium deposits. E, IVUS image and H&E‐stained section at same location; white arrows indicate intraplaque hemorrhage. H&E indicates hematoxylin and eosin; HCHF, high‐cholesterol, high‐fat; LCA, left coronary artery; LCX, left circumflex coronary artery; MT, Masson's trichrome; RCA, right coronary artery.
