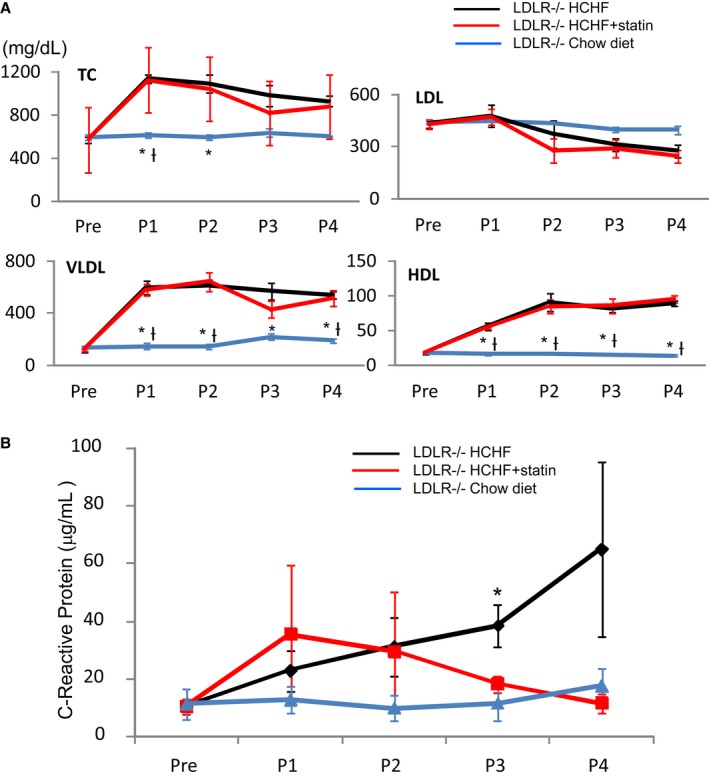
Figure 5.

Cholesterol concentrations (mg/dL) and C‐reactive protein concentrations (μg/mL) before and after statin treatment (P1–P4). A, Cholesterol concentrations (mg/dL) before (Pre) and after statin treatment (P1–P4). HDL indicates high‐density lipoprotein; LDL, low‐density lipoprotein; TC, total cholesterol; VLDL, very low‐density lipoprotein. *P<0.05 vs HCHF; † P<0.05 vs HCHF+statin (B) C‐reactive protein concentrations (μg/mL) before (Pre) and after statin treatment (P1–P4). *P<0.05, HCHF vs chow diet. P1 indicates after 1 month; P2, after 2 months; P3, after 3 months; P4, after 4 months.
