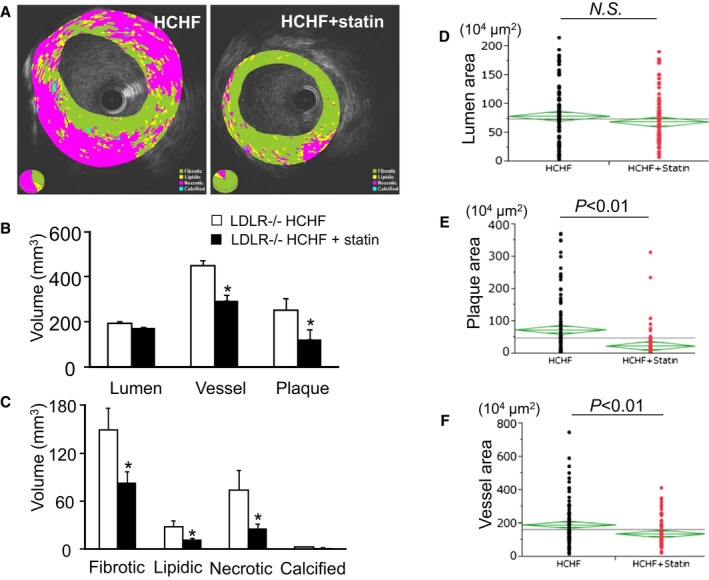
Figure 6.

Quantitative iMAP‐IVUS and pathological analysis. A, Representative iMAP‐IVUS images; components include fibrotic (green), lipidic (yellow), necrotic (red), and calcified (blue) tissues. B, Length‐modified lumen volume, vessel volume, and plaque volume; *P<0.05. C, Length‐modified volume of fibrotic, lipidic, necrotic, and calcified components; *P<0.05. Pathological measurements of lumen area (D), plaque area (E), and vessel area (F).
