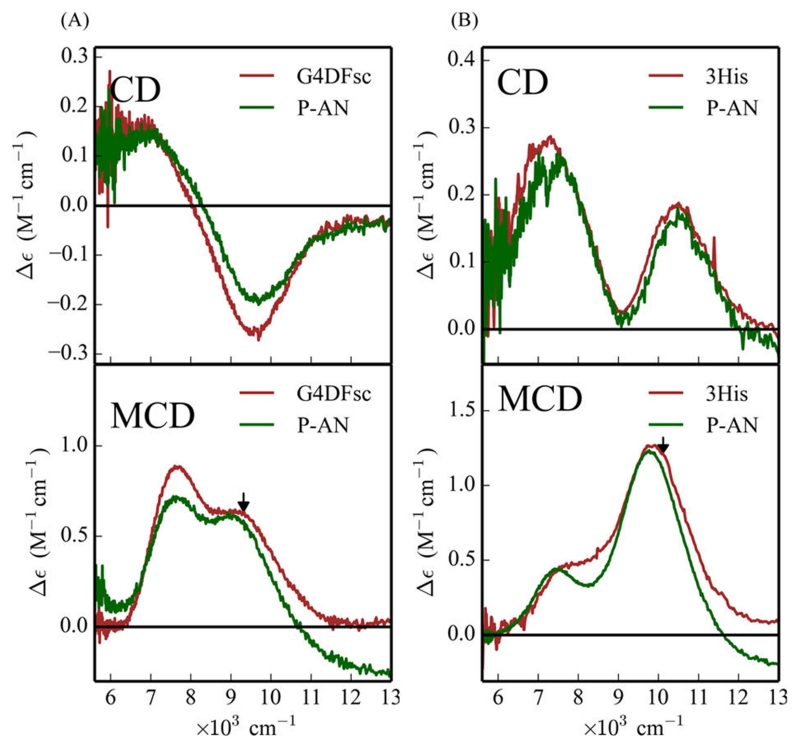
Figure 12.
Effect of p-anisidine addition on the CD (top) and MCD (bottom) of G4DFsc (A) and 3His-G4DFsc(Mut3) (B) with unbound (red) and bound (green) forms. Protein concentration is ~1 mM with 20–30-fold excess substrate. MCD data taken at 2 K and 7 T (baseline subtracted). CD data taken at 4 °C. Arrows in bottom spectra indicate where VTVH MCD data were taken.

