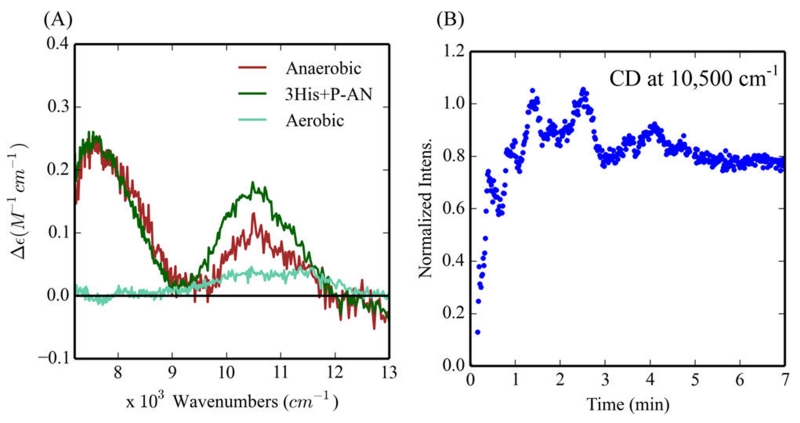
Figure 15.
NIR CD spectra of the p-anisidine reaction with 3His-G4DFsc(Mut3). (A) CD spectra of the 3His protein in the presence of p-anisidine before exposure to O2 (green), under aerobic conditions (teal), and 30 min after first allowing O2 containing buffer (~250 μM O2) to react for 60 s and then sealing the CD cell to create a closed system (red). Protein concentrations for red and teal are 250 μM. (B) Time dependence of the 10 500 cm−1 feature after first allowing 3His-G4DFsc(Mut3)+P-AN to react with O2 followed by sealing the CD cell to create a closed system (see red in (A)). Data collected at 20 °C.

