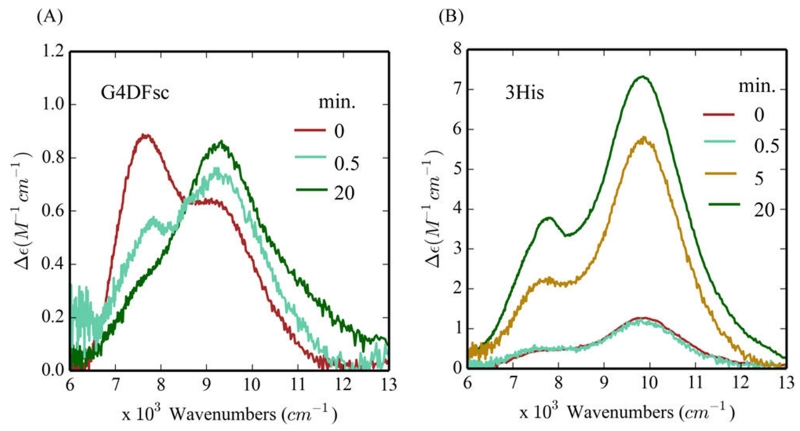
Figure 8.
MCD spectra monitoring 4-aminophenol binding at different time intervals for G4DFsc (A) and 3His-G4DFsc(Mut3) (B). All time points taken at 2 K and 7 T. The 0.5 min time interval in (A) is a composite of the initial (red) and end (dark green) spectra (30/70). The 5 min time interval in (B) has intensity consistent with a composition of the initial (red) and end (dark green) spectra (25/75).

