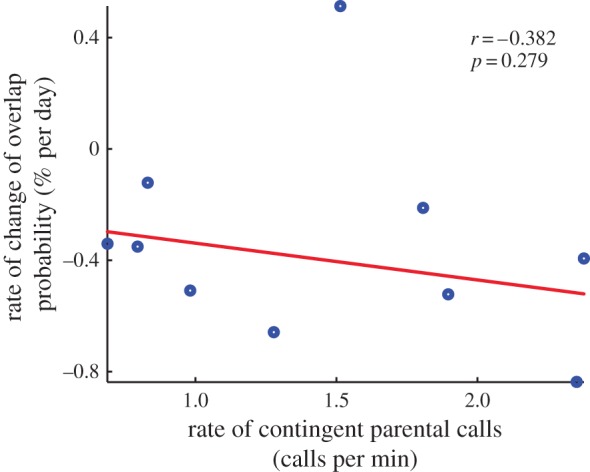
Figure 6.

Relationship between rate of contingent parental calls and rate of change in the probability to overlap. Each dot represents the data point for each infant. Red line is the linear regression line fitted to the data using robust linear regression. (Online version in colour.)
