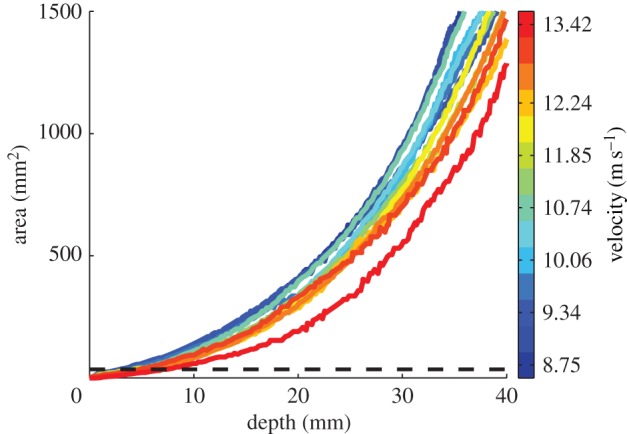
Figure 6.

For a given depth of penetration during high-speed puncture experiments, the faster the projectile is moving, the smaller the pull-in area on the impact surface. When pull-in area is plotted against penetration depth across 14 high-speed puncture experiments, an exponential relationship is seen: the farther the arrow penetrates, the larger the pull-in area becomes on the impact surface. However, arrows travelling faster show less area affected than slower arrows as seen by the colour-coding of the lines. (Online version in colour.)
