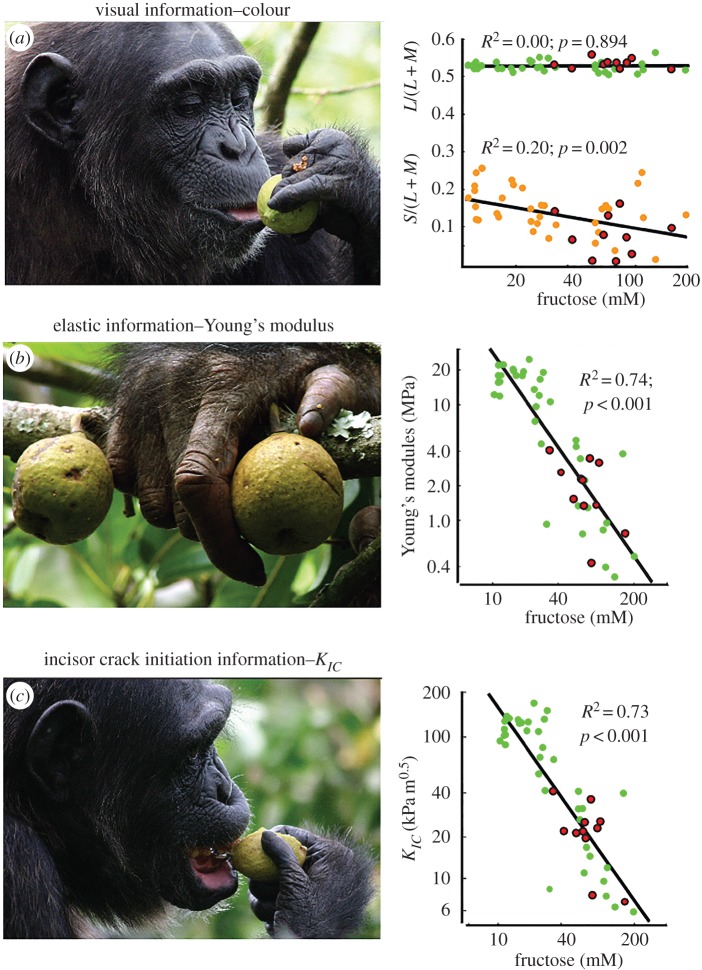
Figure 3.
Sensory assessments and corresponding information plotted as increasing functions of fructose concentration. (a) fig colour on the basis green–redness [L/(L + M); green low, red high] and yellow–blueness [S/(L + M); yellow low, blue high], the two physiological subsystems of primate colour vision. (b) The elastic deformation of a fig is determined by its Young's modulus. (c) The energetic equivalent of the critical stress intensity, KIC, relates to incisal evaluation and the ease of fracture. Enclosed circles (in red) signify consumed figs (photographs by Alain Houle, reproduced with permission).

