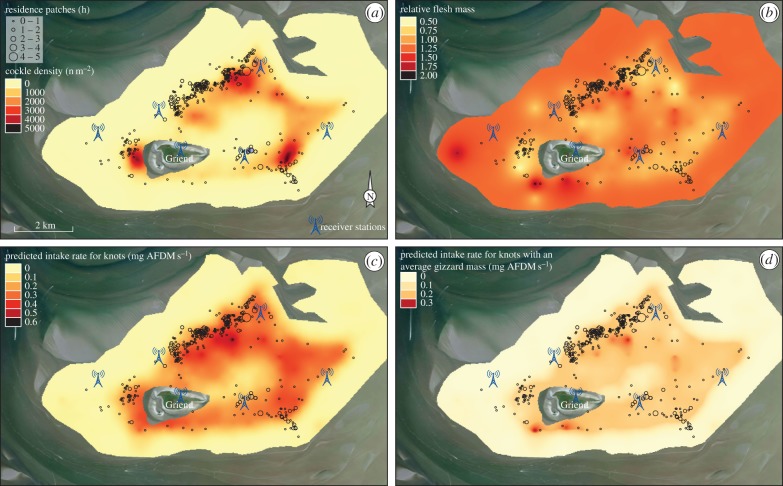
Figure 3.
Resource landscapes with the low-tide distribution of knots. The panels show interpolated (a) cockle densities (m−2), (b) relative flesh masses of cockles (AFDMflesh), (c) predicted intake rates for knots (IR, mg AFDMflesh s−1) and (d) average gizzard-mass-dependent predicted intake rates (IRavg.gizzard, mg AFDMflesh s−1). The panels additionally show the residence patches of all tagged knots. The sizes of these symbols indicate how long a bird had spent in that particular location ranging from 10 min to 4.7 h. The underlying satellite imagery was obtained from Bing in the QGIS OpenLayers plugin.

