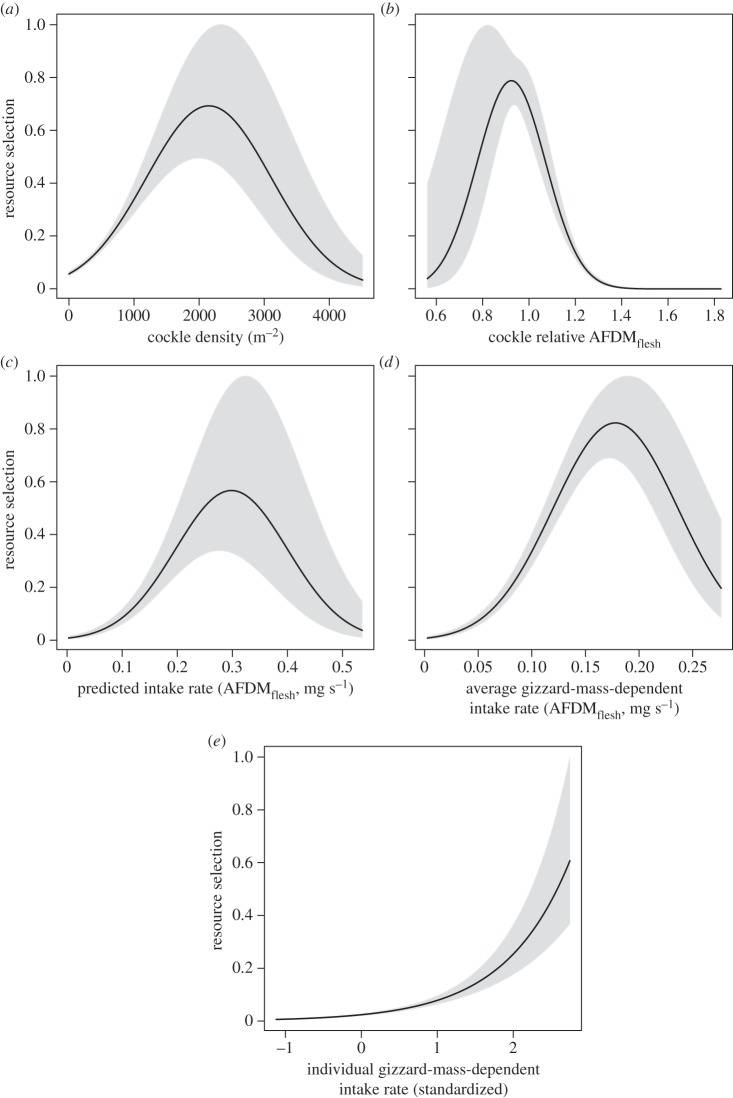
Figure 4.
Knot resource selection functions. All panels show the resource selection functions on the y-axis, which are proportional to the probability of knot occurrence. The different panels have different prey related predictor variables on the x-axis: (a) cockle density (m−2), (b) relative cockle flesh mass (AFDMflesh), (c) predicted knot intake rates without a digestive constraint (IR, mg AFDMflesh s−1), (d) average gizzard-mass-dependent predicted intake rates (IRavg.gizzard, mg AFDMflesh s−1) and (e) individual gizzard-mass-dependent predicted intake rates (IRind.gizzard, standardized). Note that these resource selection functions are the exponent of fitted logistic regression models excluding the intercepts (electronic supplementary material, table S3). As a result, for instance, the linear model in electronic supplementary material, table S3E becomes curved in (e).

