Figure 1.

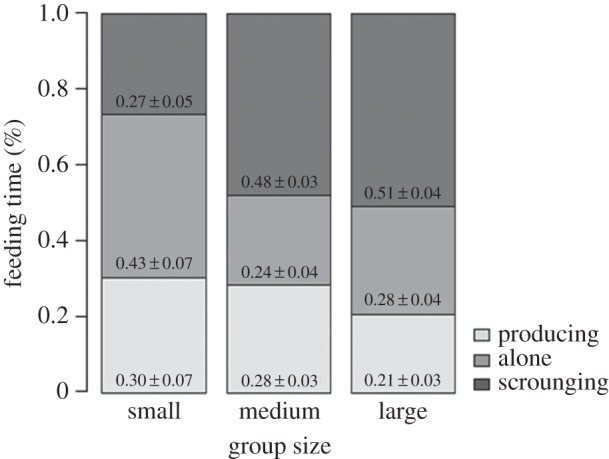
Stacked percentage bars show the relative differences in the proportion of feeding time spent producing, feeding alone and scrounging (given as mean ± s.e.) between the group-size treatments.

Stacked percentage bars show the relative differences in the proportion of feeding time spent producing, feeding alone and scrounging (given as mean ± s.e.) between the group-size treatments.