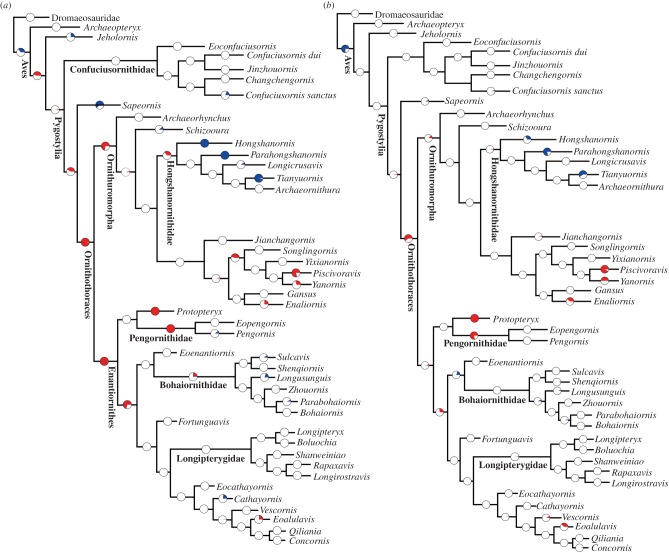
Figure 2.
Evolutionary rate analysis of Early Cretaceous birds using the ‘mbl’ scaling method and a minimum branch length of 1 Ma. (a) Result of branch likelihood test for the first most parsimonious tree where branches are not treated separately; (b) result of branch likelihood test for the same tree where terminal and internal branches are treated separately. See electronic supplementary material, figure S4, for the same analysis where the Late Cretaceous birds are included. For complete results of tests using the ‘mbl’ and ‘equal’ methods please see our Dryad data. Pie charts indicate the proportional distribution of results in 100 replicates of randomized dated trees, where red indicates branches or clades with significantly high rates, blue significantly low rates, and white non-significant (average) rates. In all cases, the null hypothesis of a single rate of evolution across the entire tree was rejected at an α of 0.01. (Online version in colour.)

