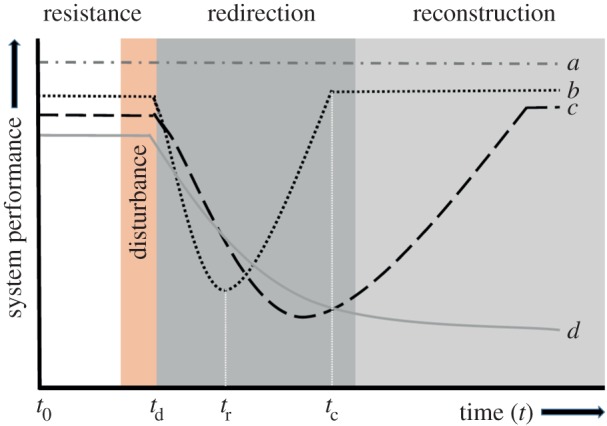
Figure 2.

Potential responses of a system to a disturbance. System performance is an experiment-specific measure of system functionality (harvesting rate, brood production rate, traffic flow). Time t0 is the start of the experiment, pre-disturbance, td indicates the start of the disturbance and tr indicates the beginning of the recovery phase for one system and tc indicates the point at which recovery is complete since system performance has returned to pre-disturbance levels. (a) Shows a system that has invested in resistance and as a result does not experience a decrease in functionality after the disturbance. (b) Shows a system that is using redirection. Although there is an initial decrease in performance, this is rapidly mitigated by rerouting flows using existing infrastructure. (c) Shows a system that uses primarily reconstruction-based resilience strategies. Since reconstruction requires the construction of new infrastructure, it takes longer to recover pre-disturbance performance. (d) Shows a non-resilient system which does not recover pre-disturbance performance. (Online version in colour.)
