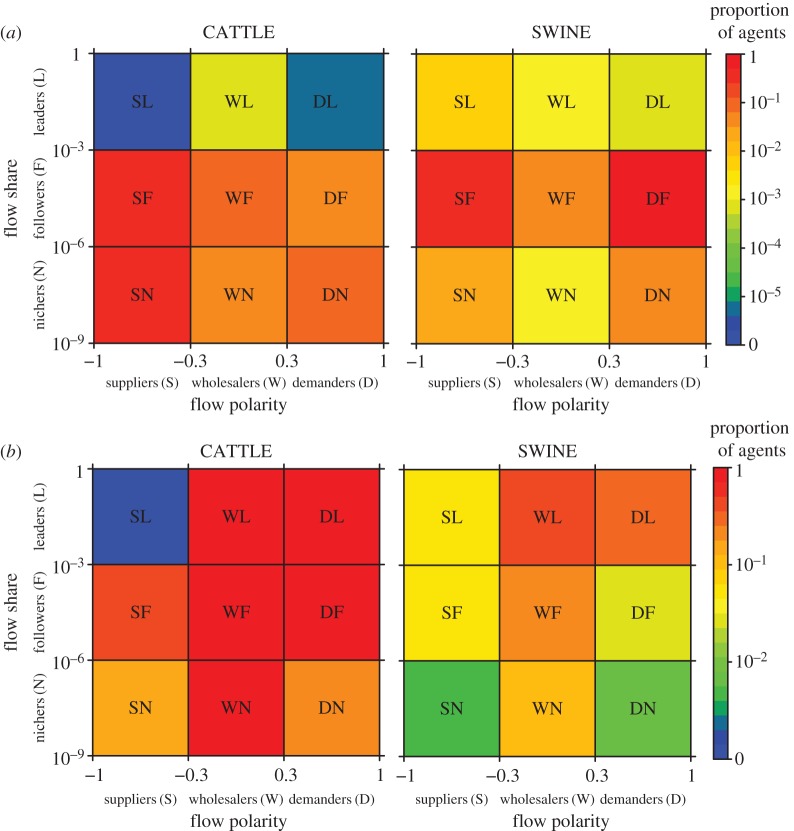
Figure 2.
Market categories defined according to flow polarity and flow share and used to assess joint economic–epidemiological risks. (a) Proportion of agents in the whole population that are in each market category, i.e. agents with the given ranges of flow polarity and flow share. (b) Proportion of agents in the LSCC that are in each market category. The LSCC is a proxy for both the probability of an outbreak and the epidemic final size. The risk of outbreak increases as the number of agents that are in the LSCC increases. To ease interpretation, flow polarity and flow share are discretized on a 3 × 3 grid, leading to a total of nine market categories. The corresponding non-discretized marginal distributions of flow polarity and flow share for the cattle and swine markets are available in figure 1a,b. Flow polarity and flow share are calculated over year 2009 for cattle and year 2010 for swine.

