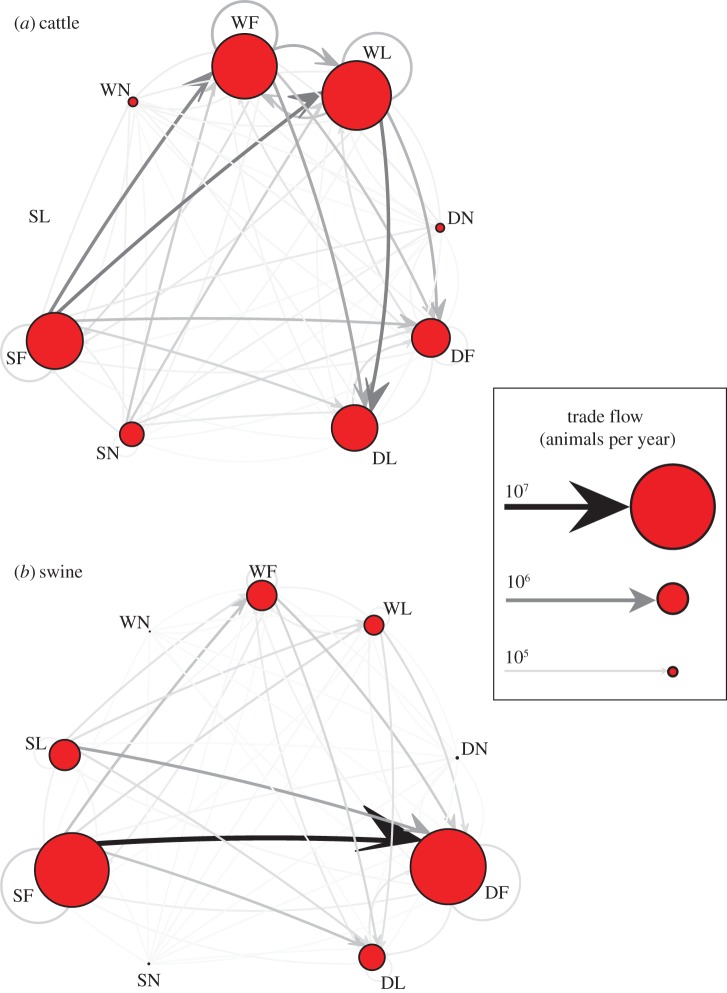
Figure 3.
Trade networks of the cattle and swine livestock markets (a,b). Data are yearly aggregated (2009 for cattle and 2010 for swine). Each node encompasses all the agents in each market category, as defined on the 3 × 3 grid in figure 2. The size of each node is proportional to the yearly aggregated trade flow summed up over all agents in each market category. Widths and colour intensity of directed links (arrows) are proportional to corresponding yearly aggregated trade flow from/to each aggregated category, summed up over all the agents in the categories involved in in- or out-movements.

