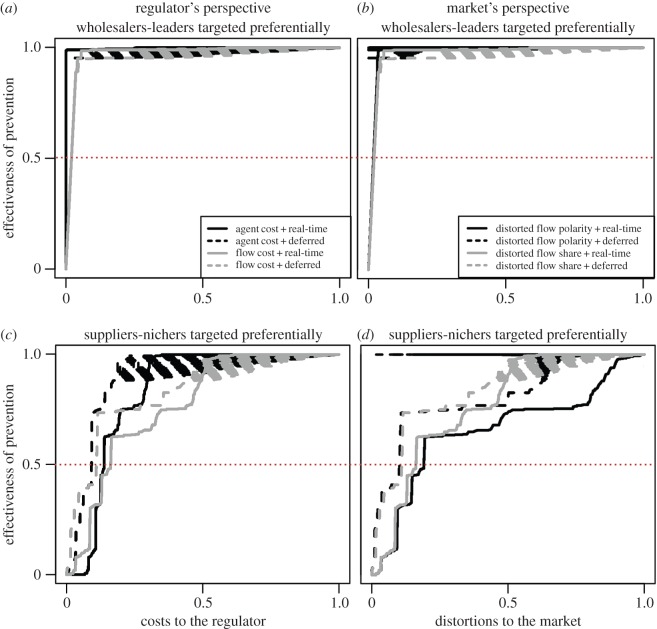
Figure 5.
MCDA of contrasting targeted control strategies in the swine livestock market. Targeting strategies in the swine market are implemented over year 2010. Market categories are defined either over year 2010 (real-time information available on agents, plain curves) or over January 2010 (deferred information available on agents, dashed curves). The rest of the legend is identical to figure 4.

