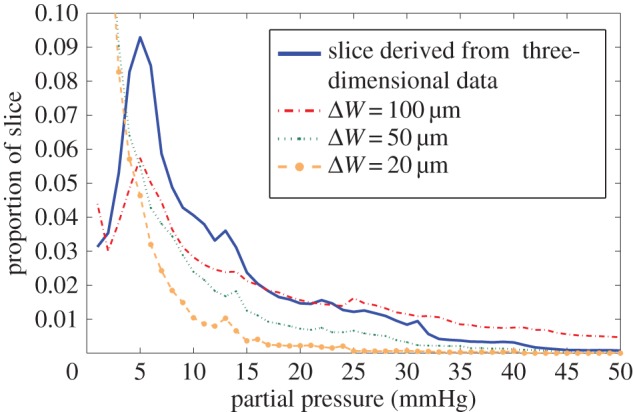
Figure 8.

Oxygen histogram for a single slice of the MC-38 mouse tumour at z = 136 µm, derived from the full three-dimensional section and two-dimensional approximations created from vessel sections lying in the subvolume width ΔW. The oxygen histogram for two-dimensional slices does not in general represent the underlying distribution.
