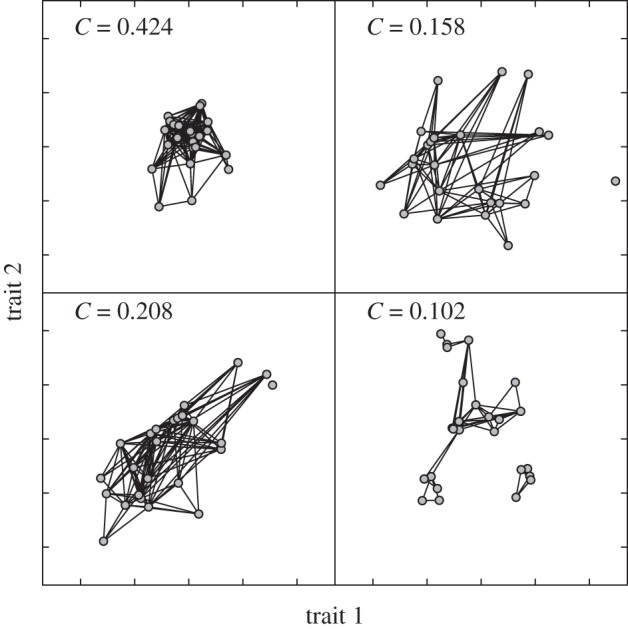
Figure 2.

The effect of functional trait structure and diversity on food web topology. The figure illustrates the potential impact of different aspects of the multivariate trait distribution while keeping the trait-matching rules constant: trait variability (top left compared with top right), trait correlation (top left compared with bottom-left) and non-uniform trait distribution (clustering, top left compared with bottom right). Formal proof of the effect of trait correlation is provided in box 2. The simulations are run with a two-dimensional adaptation of the niche model [69]. We generalized the model to several niche axes and flexible distributions of the different traits, but keeping the trait-matching function based on the ordering of niche positions and the existence of a diet optimum. Each point represents the position of a species in a two-dimensional trait space (foraging and vulnerability traits). Each line represents a trophic interaction. The predator has the largest trait value (for both traits) and the prey the smallest. The connectance of the network, C, is indicated on each panel. It emerges from the underlying rules, instead of being predetermined, as in the original model. Niche position for each species is drawn from a bivariate normal distribution with mean trait value of 0. Correlation between niche axes is null for all panels, except for the bottom left panel that has a correlation of 0.8. The standard deviation for each trait is set to 10, except for the top left panel that has standard deviation of 5. A non-uniform distribution of traits is simulated by five niche positions ni from the bivariate normal with mean 0 and standard deviation of 10, and then after drawing four additional species with niche positions of mean ni and standard deviation of 3.16. The range r for each axis is obtained by drawing a random number from a uniform distribution between 0 and 30. The centroid o for each axis is obtained by drawing a random number from a uniform distribution between the minimal niche position and r/2. Preys are of a given predator i are the species whose niche falls within the interval oi − ri/2 and oi + ri/2.
