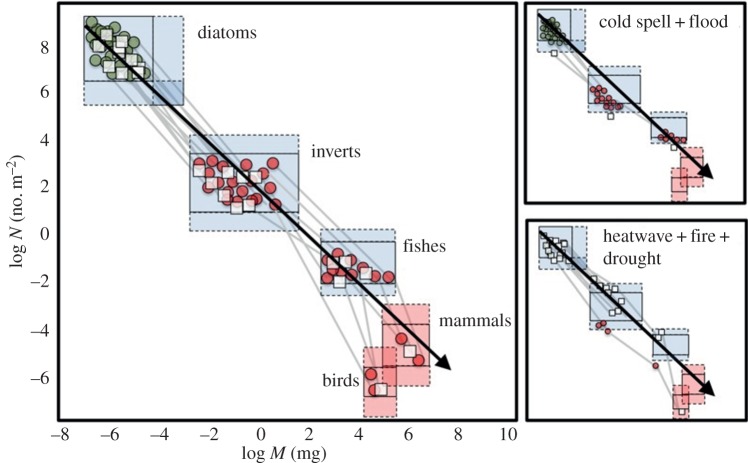
Figure 3.
Conceptual diagram of shifts in body mass and abundance under two scenarios of combined extreme events (cf. figure 1). The white squares represent taxa associated with more lentic conditions, the coloured circles represent taxa associated with more lotic conditions. Green nodes represent producers, while red nodes represent consumers. The red boxes represent endotherms; the blue boxes ectotherms. Note, responses can be multifaceted and include species loss (especially among the higher trophic levels and endotherms), population declines (or occasionally increases, if predator release occurs), as well as changes in links and higher-level properties related to system complexity and energy flux.

