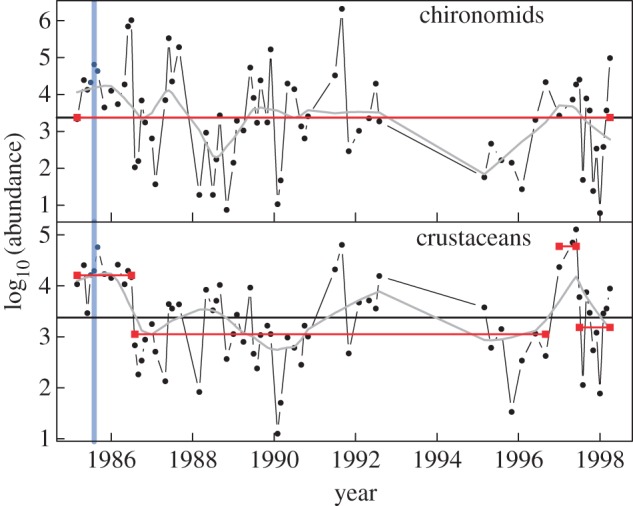
Figure 5.

The correlated abundance of two trophic levels over 13 years following an extreme event in the Glenfinish River in Ireland. Abundance (number m−2) is in log10 scale. Significant break points in time series trend determined through circular binary segmentation analysis are shown by the red horizontal lines; the mean of all time series is shown by the black horizontal line. The grey line corresponds to a LOWESS smoothing. The vertical blue line indicates the catastrophic flood event in 1986 (adapted from [29]).
