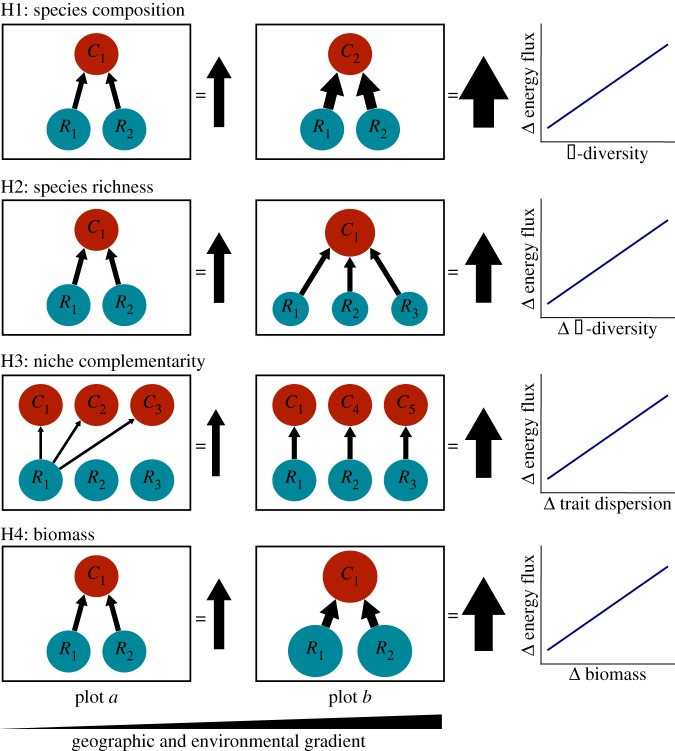
Figure 1.
Graphical representation of the four proposed mechanisms (H1–H4) that drive spatial variation in ecosystem functioning. Hypothetical examples illustrate how each mechanism would drive variation in energy flux between two spatially and environmentally distinct sampling plots (a,b). Blue and red circles represent biomass-weighted (circle size) resource and consumer populations, respectively, with Ri and Ci denoting different resource and consumer species. Black arrows within the example communities indicate hypothetical energy fluxes between resources and their consumers, with the overall sum of energy flux indicated to the right of each hypothetical community. Graphs to the right of the example communities indicate the hypothesized relationship between turnover in the measured community attribute used to test the hypothesis and turnover in energy flux.

