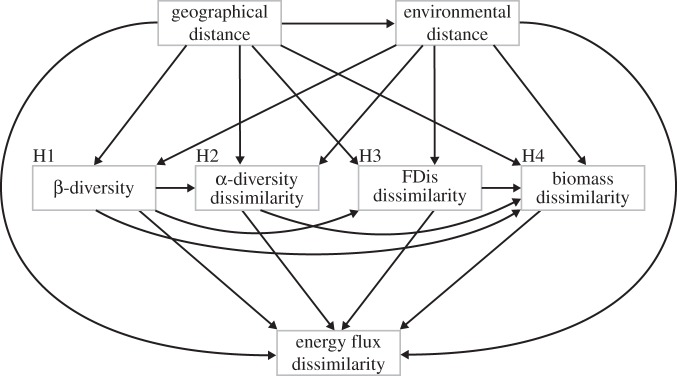
Figure 2.
Diagram of all the possible effects that were tested in the path model framework of this study. Variables in the path models are indicated by grey boxes and represent distance matrices. H1–H4 denote where hypotheses 1–4 (as in figure 1) were tested in the model. ‘FDis' stands for functional dispersion.

