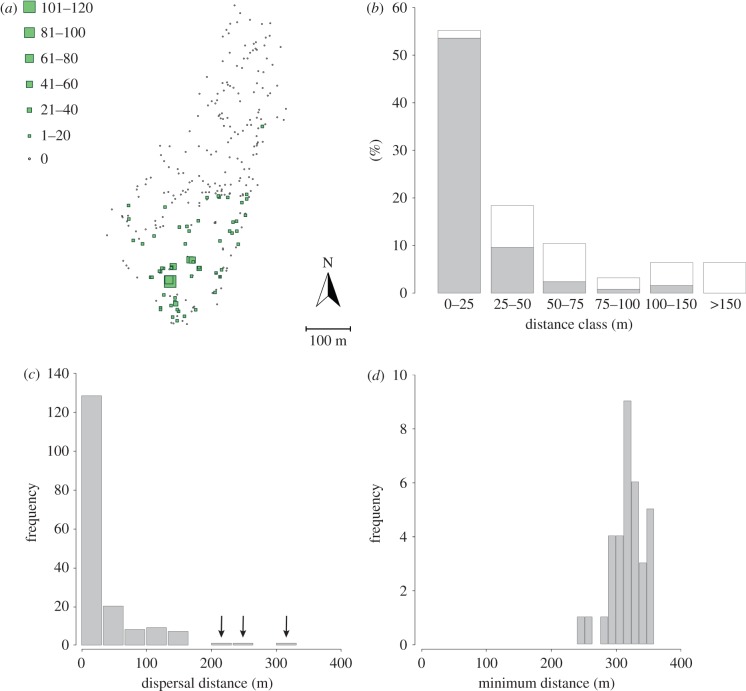
Figure 2.
Empirical observations from our study system. (a) Seed rain of T. baccata. Squares represent seed-plots and are proportional to the number of yew seeds collected; dots represent seed-plots that did not receive T. baccata seeds. (b) Distribution of observed flight distances to first perch of frugivorous birds feeding on T. baccata. Grey bars represent short-distance seed dispersers, which include Coccothraustes coccothraustes, Erithacus rubecula, Phoenicurus ochruros, Sylvia atricapilla and Turdus merula. White bars represent long-distance seed dispersers, which include Turdus viscivorus, T. philomelos and T. torquatus. (c) Frequency distribution of the dispersal distances of seeds from known origin. All the seeds but three (indicated by an arrow) came from a source tree inside the fence. (d) Frequency distribution of the minimum dispersal distance of the seeds from unknown sources, i.e. the minimum distance between the seed-plot containing the immigrant seed and the limit of the complementary area explored (dotted line in the electronic supplementary material, figure S1).

