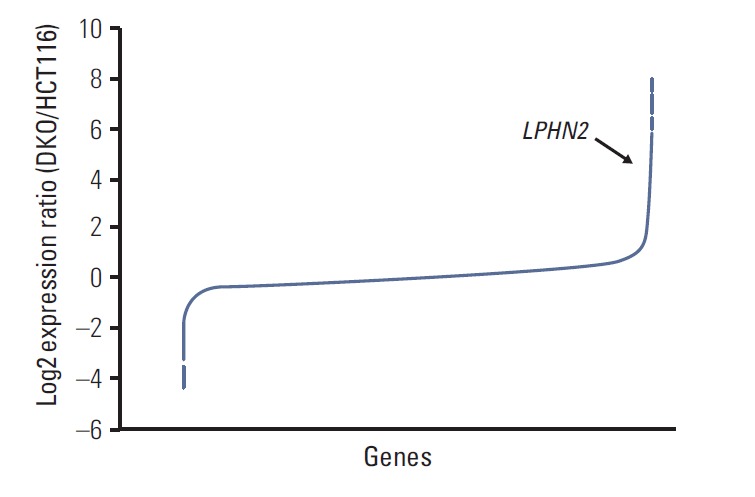
Fig. 1.

Microarray analyses of mRNA expression in HCT116 and DKO cells. Microarray analyses were performed in HCT116 cells and DNMT1/DNMT3B double knockout derivative DKO cells. Microarray data results are shown as the log2 expression ratio of genes between HCT116 and DKO. The black arrow indicates LPHN2.
