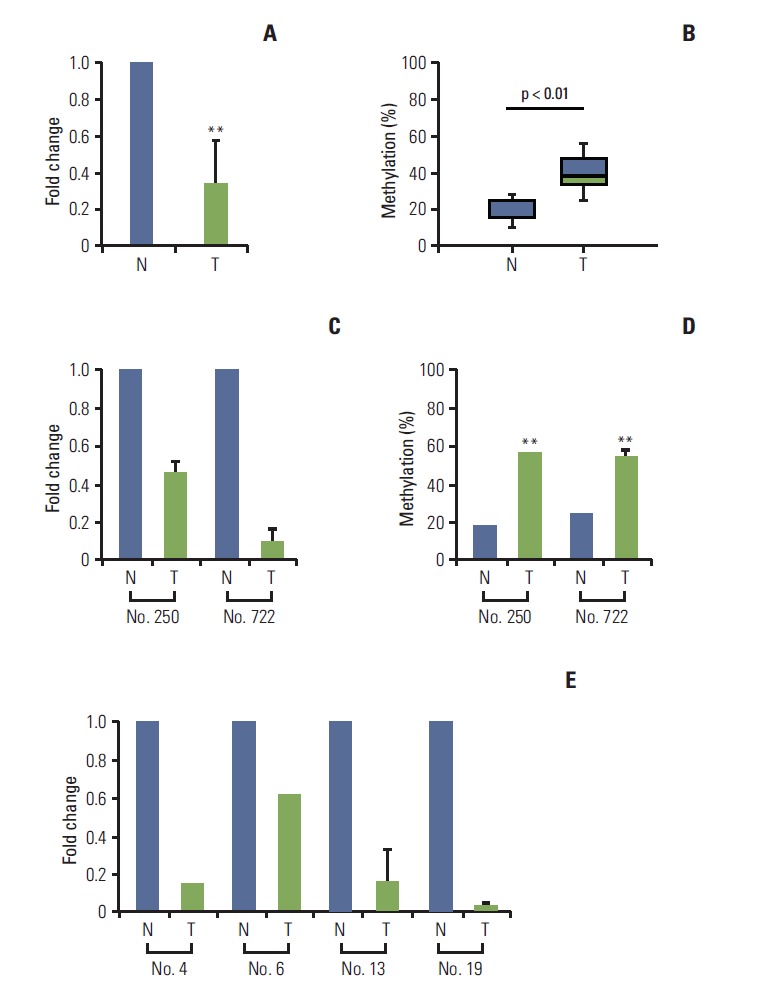
Fig. 4.

Loss of LPHN2 expression in human gastric and colon primary tissues. mRNA expression in primary gastric tissues was analyzed using quantitative real-time reverse transcription polymerase chain reaction (qRT-PCR) and the methylation status of LPHN2 was confirmed via pyrosequencing analyses. Loss of LPHN2 mRNA expression was shown in 18 of 24 primary gastric tissues. (A) A summary of LPHN2 expression in 18 primary gastric tissues compared with normal tissues presented as fold change of relative mRNA expression. (B) Among 18 primary gastric tissues, nine of 18 showed hypermethylation of LPHN2 CpG islands compared to normal control tissues. The methylation ratio percentage is also presented as a box plot. (C) LPHN2 expression levels in primary gastric tissues were analyzed using qRT-PCR. LPHN2 expression was normalized to 18S ribosomal RNA and is shown as fold change relative to their normal tissue samples. Data are expressed as the mean±standard deivation. (D) Bisulfite-treated gDNAs from patient No. 250 and No. 722 were used to determine the methylation status of the LPHN2 promoter region using pyrosequencing analyses. (E) LPHN2 expression levels in primary colon tissues were analyzed by qRT-PCR and are shown as fold change relative to their normal tissue samples. N, normal tissue; T, tumor tissue. **p < 0.01 using Student’s t test.
