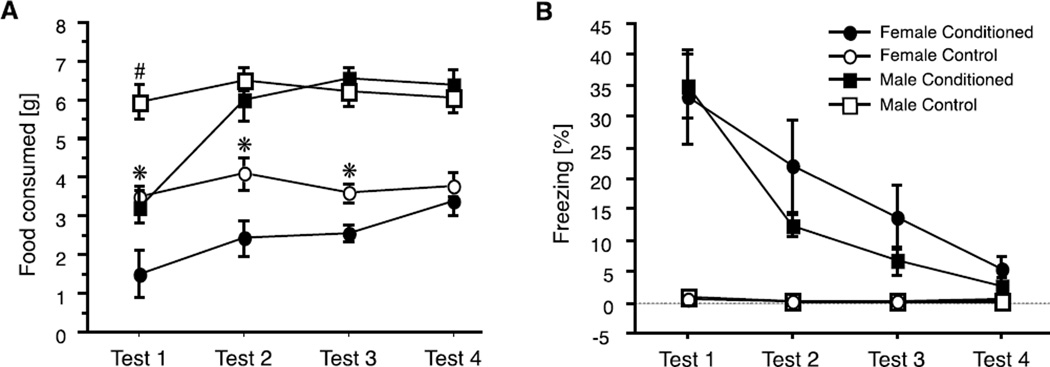
Figure 9.
(A) Food consumption (mean ± SEM) of male and female rats during tests with fear cue presentations. During training, rats in the conditioned groups received tones paired with footshocks, while rats in the control groups received tones but no shocks. Tests were conducted on separate days, under acute food deprivation (no footshocks given during tests). Significant differences (p < 0.05) between Conditioned and Control groups are indicated by * for females and by the # for males. (B) Conditioned freezing behavior during food consumption tests. Graphs show percentages (mean ± SEM) of the total time spent freezing during the tests. Adapted from (Petrovich and Lougee, 2011), with permission.

