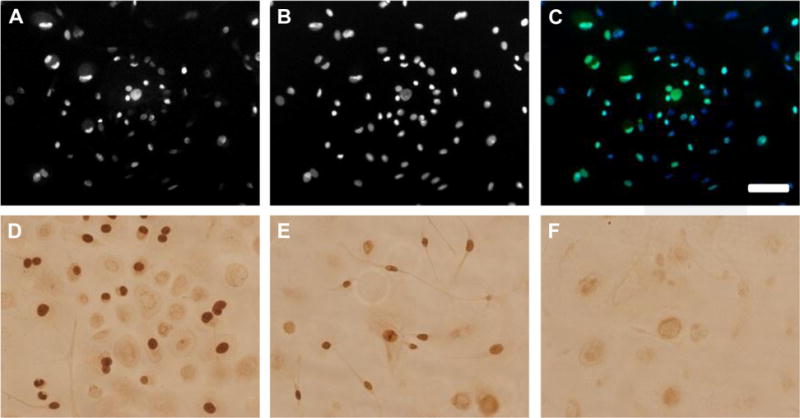
Figure 2.

DUOC products include proliferating cells. (A–C) Fluorescent images of DUOC stained with (A) Ki67 and (B) DAPI; (C) is an overlay of green Ki67 and blue DAPI signals. (D–F) Peroxidase/diaminobenzidase-linked BrdU staining of DUOC. (D and E) Dark brown nuclei that have incorporated BrdU. (F) Control cells not exposed to BrdU. Scale bar = 50 mm.
