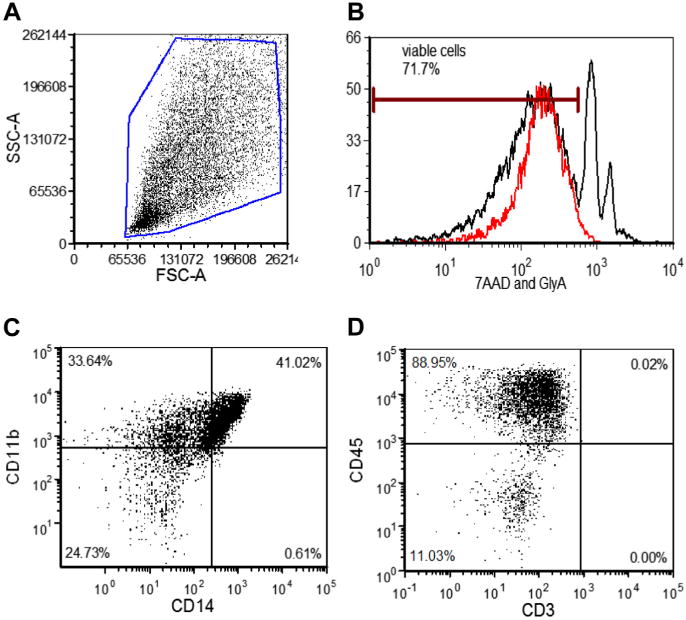
Figure 4.

Flow cytometric analysis of DUOC-01. (A) Typical flow forward and side-scatter (FSC, SSC) and viability staining cytograms used to identify viable cells for analysis of marker expression. (B) Flow histogram of gated population in (A) stained with 7-amino-actinmycin (7AAD) (red line) and anti–glycophorin A (GlyA) to identify viable cells and erythrocytes, respectively. (C) Expression of CD11b and CD14 and (D) of CD3 and CD45 by cells in DUOC-01 product. Cells analyzed were gated as shown in (A) and (B). In all cases, fluorescence gates for antibody staining were set by use of cells exposed to appropriate isotype controls.
