
Figure 3.
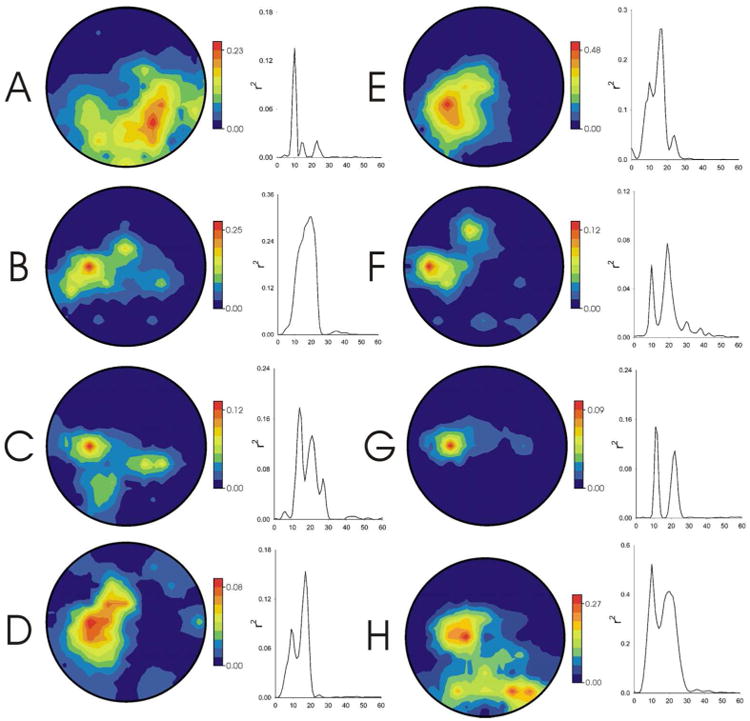
opography (nose at top) and spectrum of the correlation between SMR feature amplitude and the SMR control condition (i.e., SMRhigh or SMRlow) for each subject for the last Phase-2 session. Note that control is focused topographically and spectrally over sensorimotor cortex.