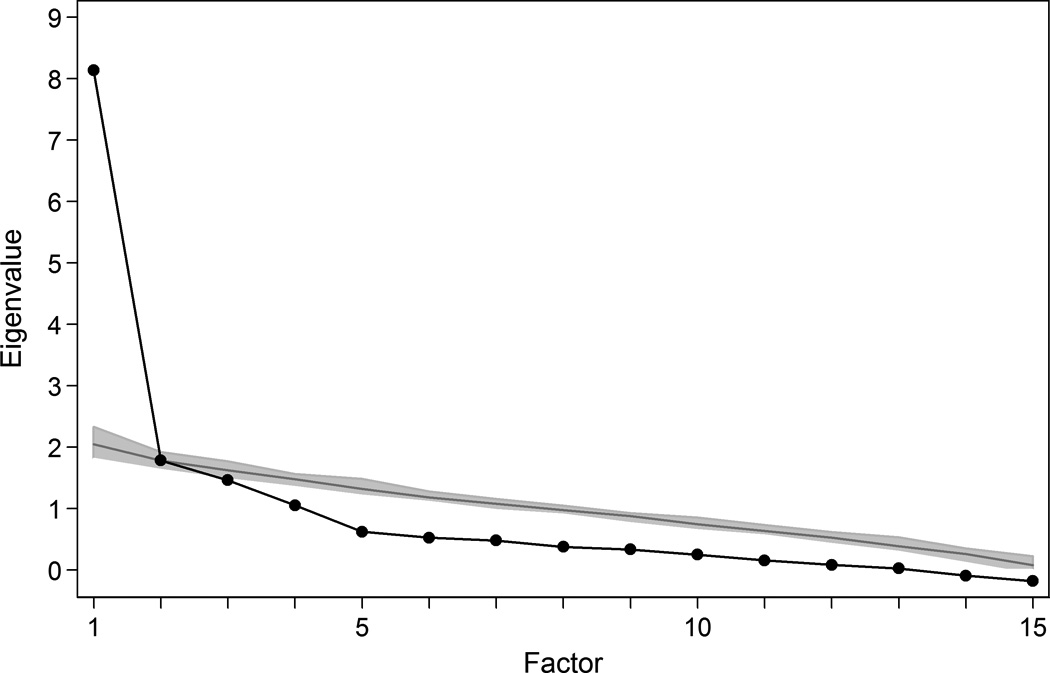
Figure 1. Scree Plot from Parallel Analysis: Results from SAGES (N=300).

Legend. Observed eigenvalues (connected black dots) and the eigenvalues expected based on random resampling of the original data. Random data was based on 55 reshufflings of existing data.
