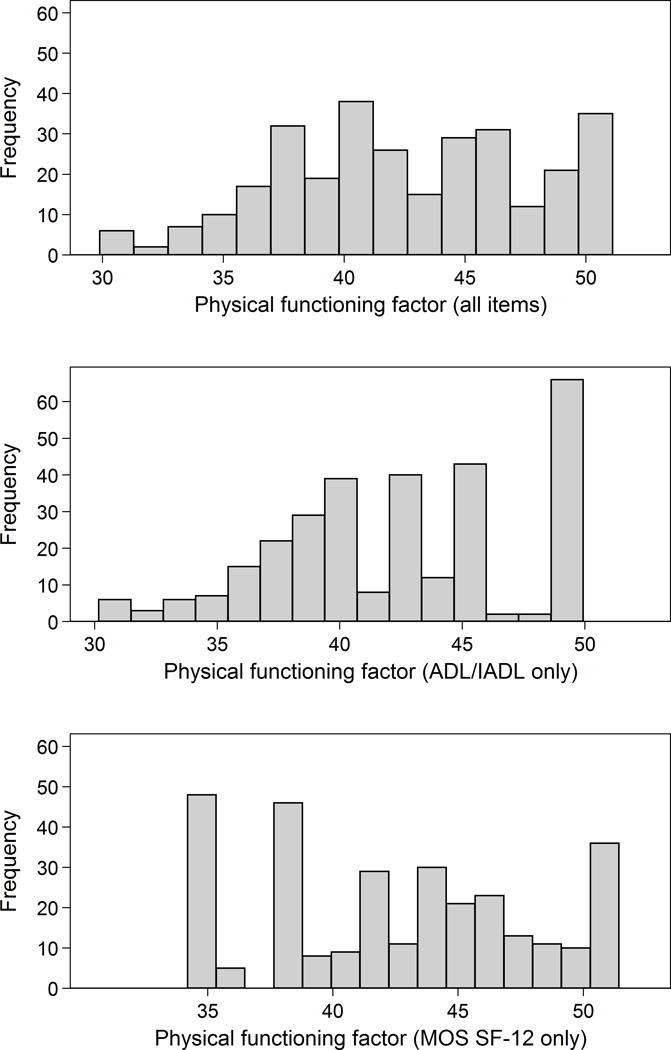
Figure 3. Distribution of Physical Functioning in the SAGES study (N=300).

Legend. Distribution of the physical functioning score with overlayed Normal distribution for factor scores derived using all items, ADL/IADL items only, and MOS SF-12 items only. A score of 50 is the mean level of physical functioning in the NIH/PROMIS normative sample. Higher scores indicate less impairment.
