Figure 1.

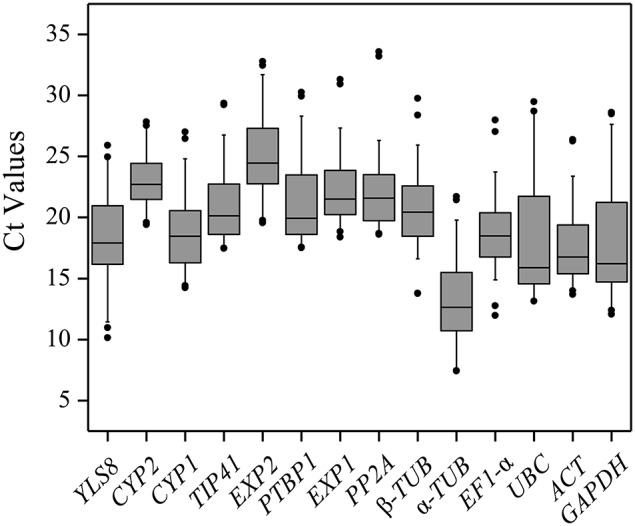
Distribution of Ct values of candidate reference genes across all of the samples. The Box-plot contains the mean, interquartile range, non-outlier range, and outlier.

Distribution of Ct values of candidate reference genes across all of the samples. The Box-plot contains the mean, interquartile range, non-outlier range, and outlier.