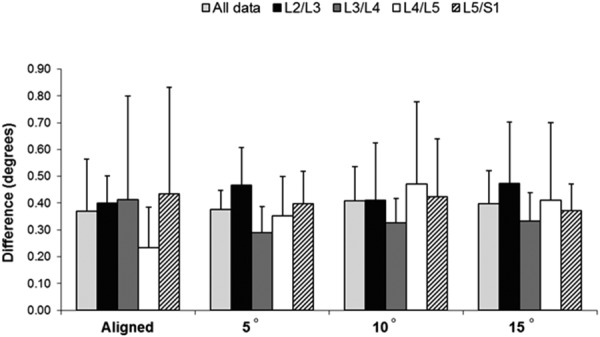
Fig. 4.

Comparison of mean absolute differences for fluoroscopy versus optoelectronic-assessed spinal motion. The mean absolute difference was calculated for each individual specimen; the graph shows the mean (SD) of the mean absolute differences for all the six specimens. The only motion segments showing significantly different mean absolute differences were L2–L3 and L3–L4.
