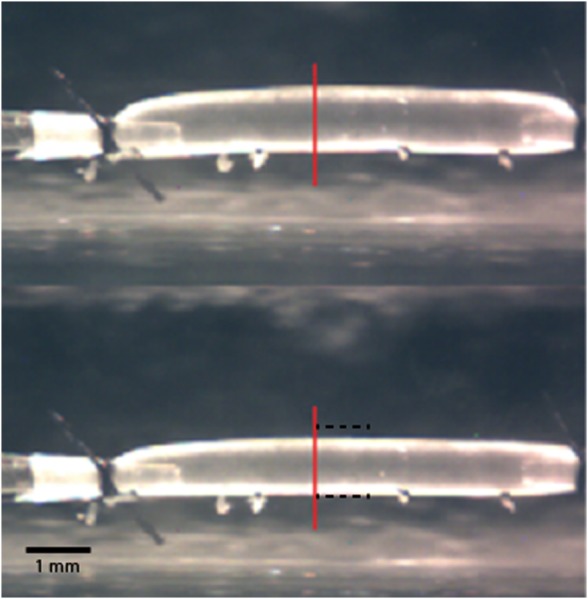
Fig. 1.

Illustrative images captured with the video microscope of a Fbln5+/+ descending thoracic aorta (DTA) loaded at 90 mmHg and an axial stretch of both before (top) and after (bottom) 15 min of exposure to 80 mM KCl. Similar, though diminished, responses were observed in Fbln5−/− specimens. The vertical line shows the region where outer diameter and wall thickness were measured; the horizontal dashed lines in the bottom image represent the outer diameter before exposure to high KCl. Note the ligated intercostal branches as well as the glass cannulae and ligatures used to secure the sample.
