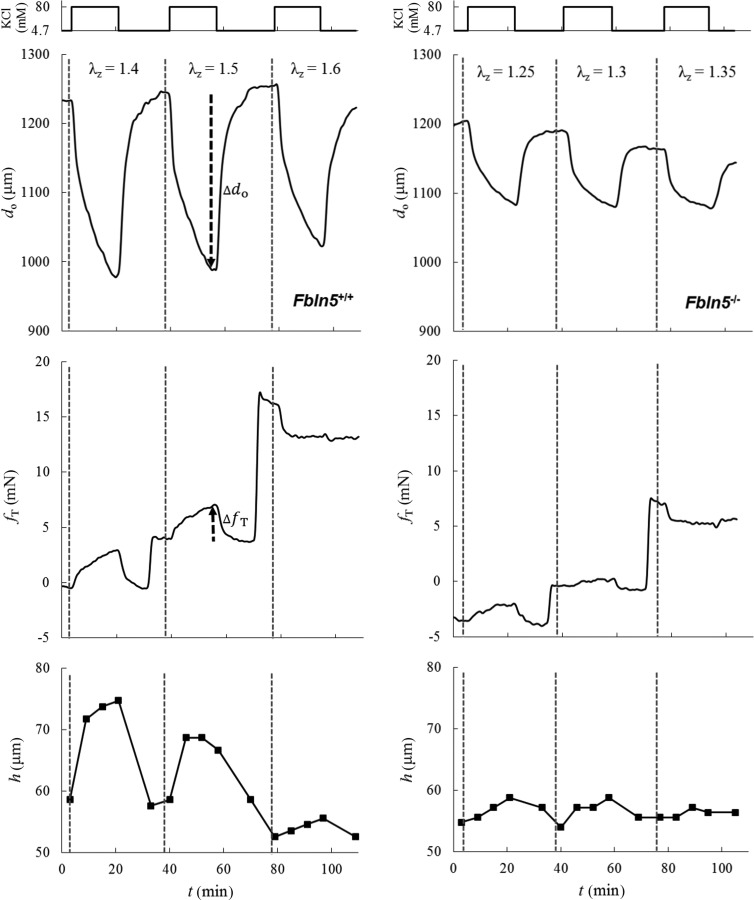
Fig. 2.

Illustrative time courses of change in outer diameter measured with the video microscope (—top panels), axial force measured by the force transducer (—middle panels), and wall thickness measured with the OCT (h—bottom panels), all when contracted with 80 mM KCl at 90 mmHg for Fbln5+/+ (left) and Fbln5−/− (right) DTAs at genotype-specific values of axial stretch: for Fbln5+/+ and for Fbln5−/−. Recall that contraction was maintained at each condition for ∼15 min prior to a wash-out with normal Krebs solution. The vertical dashed lines delineate changes in the different fixed values of axial stretch; the dark dashed arrows illustrate, for a single case, the magnitude and direction of contraction-induced changes in outer diameter and axial force that are considered in Fig. 3.
