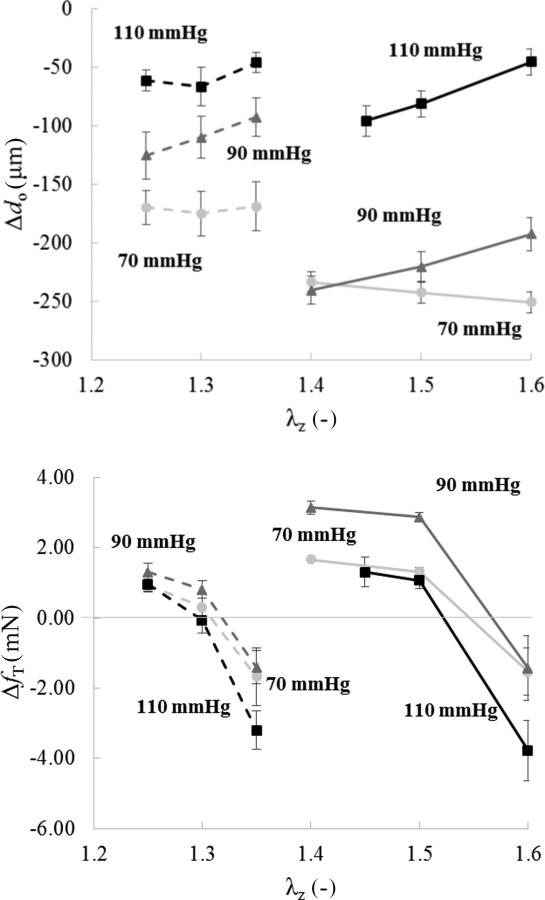
Fig. 3.

Changes, relative to genotype-specific baseline values, in outer diameter (—top) and axial force (—bottom) after 15 min of high K+ contraction at 70 (circle), 90 (triangle), and 110 (square) mmHg and different values of axial stretch: for Fbln5−/− (dashed line) and for Fbln5+/+ mice (solid line)
