
Figure 4.
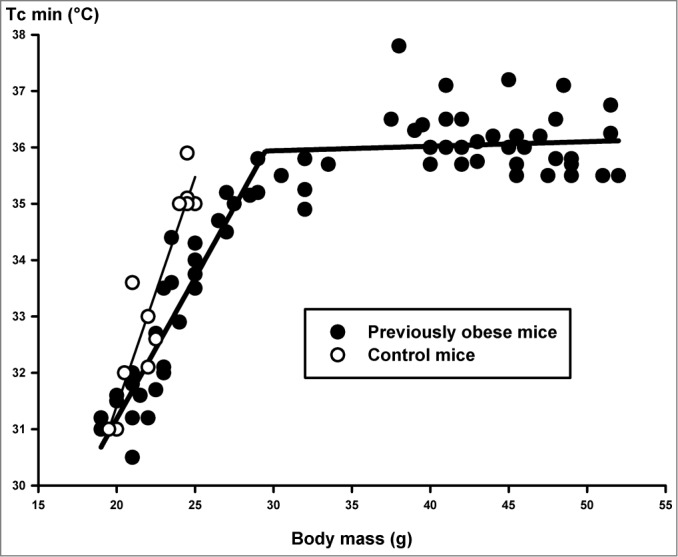
Daytime minimum core temperature (2-hour averages) (Tc min) as a function of body mass in obese (Group-2, filled symbols) and control (Group-1) mice (open symbols) during fasting. Measurements on the same animals were performed on different fasting days. Regression lines for control group (thin) and obese animals (thick) are indicated. For details of statistics see Results.