
Figure 3.
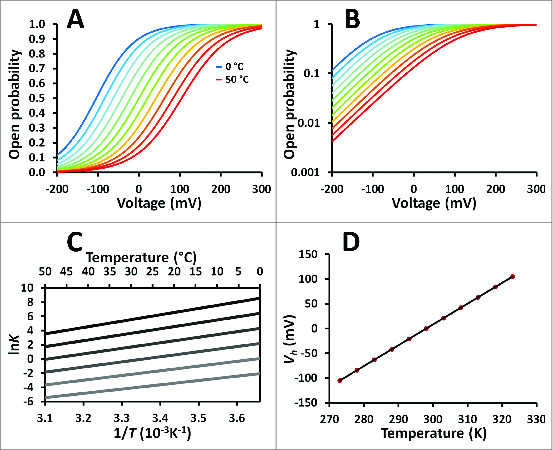
The 2-state model. (A) Conductances vs. voltage curves of a cold-activated channel with voltage dependence. Parameters: ΔH0 = −60 kJ/mol, ΔS0 = −200 J/Kmol, zδ = 0.5; temperatures: from 0 to 50°C in 5°C steps (blue-like curves represent colder temperatures and red-like curves representing warmer temperatures). (B) Same data in A plotted in a semilogarithmic graphic. (C) The van't Hoff plot family from data in A at several voltages (−200, −100, 0, 100, 200 and 300 mV, the darker line representing the most positive membrane voltage). (D) The half activation voltage versus temperature curve for the data in A.