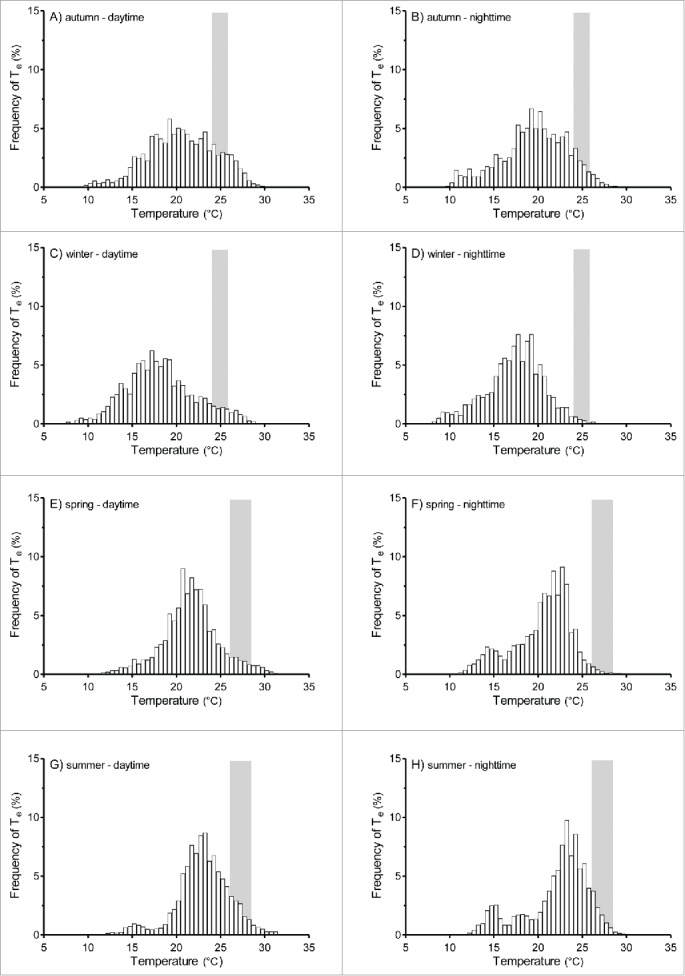
Figure 3.

Frequency distribution of environmental temperatures (Te) registered during the 4 seasons at daytime and nighttime. Daytime: 0600–1800; nighttime: 1800–0600. The shaded area represents the ranges of preferred Tb (Tset) calculated in the laboratory during the summer and winter seasons.
