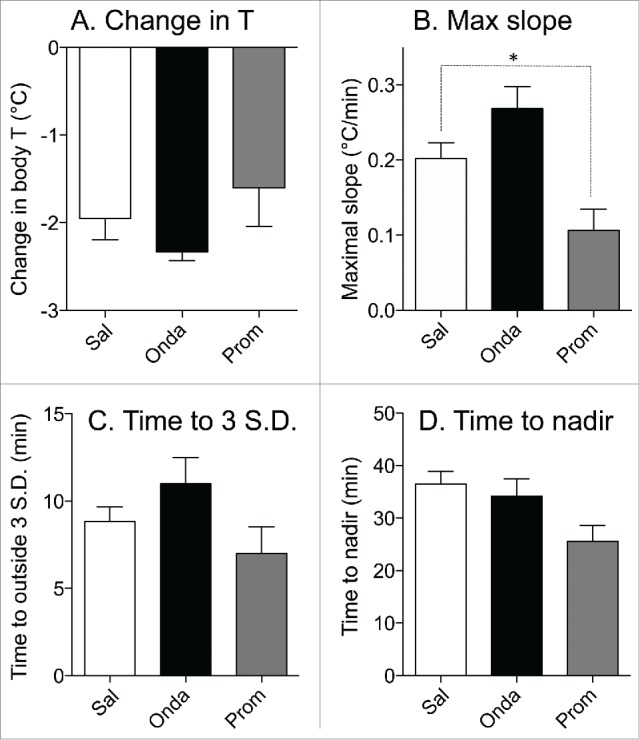
Figure 7.

Effects of ondansetron (2 mg/kg i.p.) and promethazine (10 mg/kg i.p.) on hypothermic responses elicited by provocative motion. Bar graphs represent results of statistical analysis of the raw data shown in Figure 4; data for comparison were collected from the last 5 min of rotation. (A) Effects on changes in the core body temperature; (B) effects on the maximal slope of the fall in core body temperature; (C) effects on the minimal time during which temperature fall reached values exceeding 3 SD computed from the baseline period; (D) effects on the time to the nadir of the temperature fall. White bars: control (saline, Sal); black bars: ondansetron (Onda); gray bars: promethazine (Prom). Data presented as Mean ± SEM; N = 6 * - P < 0.05.
