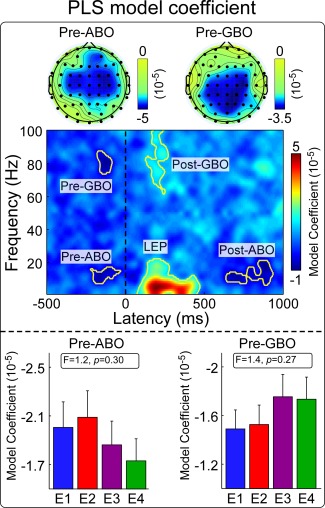
Figure 2.

The relationship between laser‐elicited EEG spectrogram and the intensity of pain. Top panel: MVLR model coefficients indicating the relationship between EEG spectrogram and the intensity of pain. Five time‐frequency clusters of the EEG spectrogram (C4‐nose) were significantly modulated by the intensity of pain: “Pre‐ABO” (−221 to −31 ms, 8–15 Hz), “Pre‐GBO” (−180 to −85 ms, 74–87 Hz), “LEP” (74–470 ms, 1–22 Hz), “Post‐ABO” (637–935 ms, 8–20 Hz), and “Post‐GBO” (127–377 ms, 62–100 Hz). Scalp topographies of MVLR model coefficients within the “Pre‐ABO” and “Pre‐GBO” clusters are displayed in the top parts. Bottom panel: MVLR model coefficients within the “Pre‐ABO” and “Pre‐GBO” clusters at different stimulus intensities (E1–E4). Both parameters were not significantly modulated by stimulus intensity. [Color figure can be viewed in the online issue, which is available at http://wileyonlinelibrary.com.]
