
Figure 5.
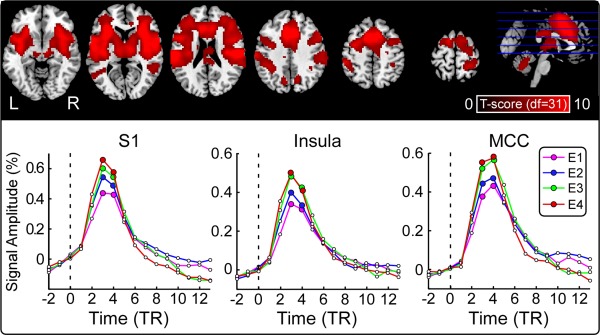
Laser‐evoked BOLD responses. Top panel: Brain regions activated by laser stimuli (cluster level: P FWE < 0.05). Significant increases in BOLD signal to laser stimuli, across the four stimulus energies, are shown in red. L: left, R: right. Bottom panel: Average BOLD time courses in three representative regions (contralateral S1, contralateral insula, and MCC) at different stimulus energies (E1–E4). [Color figure can be viewed in the online issue, which is available at http://wileyonlinelibrary.com.]