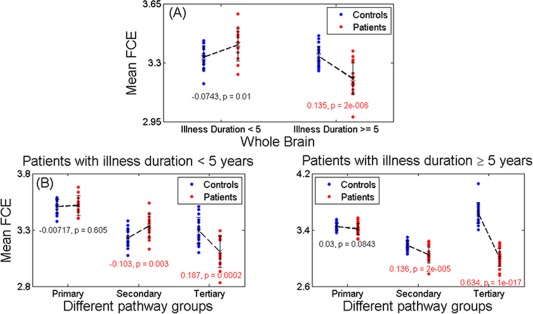
Figure 2.

FCE in different fiber pathway. (a): In patients < 5 years, the FCE was slightly increased in patients (0.0743, P = 0.01, d = 0.91), and significantly decreased (0.135, P = 2 × 10⁻¹⁶, d = 1.69) in patients ≥ 5 years comparing with controls. (b): Left panel: In patients < 5 years, the functional connectivity (FCE) entropy was almost unchanged (−0.00717, P = 0.605, d = 0.10) in primary pathways, significantly increased (−0.103, P = 0.003, d = 1.12) in secondary ones and significantly decreased (0.187, P = 0.0002, d = 1.46) in tertiary ones comparing with controls. Right panel: In patients ≥ 5 years, the FCE was close to significantly decreased (0.03, P = 0.0843, d = 0.44) in primary pathways, significantly decreased (0.136, P = 2 × 10⁻⁵, d = 1.47) in secondary and most significantly decreased (0.634, P = 1 × 10⁻¹⁷, d = 4.66) in tertiary when compared with controls. All the effects of age, sex, and dose have been removed. [Color figure can be viewed in the online issue, which is available at http://wileyonlinelibrary.com.]
